Starlight Private Global Real Estate Pool 2024 Outlook
The Starlight Private Global Real Estate Pool is designed to provide accredited investors with access to institutional-quality, private assets in a solution that provides both liquidity and income. The unique design (target 80% private asset funds, target 20% public listed securities) allows investors to partner with best-in-class, global institutional managers of private assets and invest alongside some of the largest pension funds, insurance companies and wealth managers in the world.
2023 Year in Review
In 2023 the Starlight Private Global Real Estate Pool (“Real Estate Pool”) delivered a -4.7% total return (Series F). The major detractor from performance in 2023 was currency, reducing returns by approx. 400 bps. Currency was very volatile during the year and especially in November and December of 2023. The Real Estate Pool was not hedged during most of the year and US dollar weakness at year end was driven by a rally in risk assets and the anticipation of up to six rate cuts in 2024.
The listed securities portfolio experienced 26 dividend and distribution increases with an average increase of 10.5%. The listed securities portfolio generated a 3.5% total return in 2023 however, the lower weighting in listed securities means that this portfolio contributed less than 10 bps to overall performance.
Peppertree Capital Fund IX
Peppertree Capital is the dominant developer of cell towers in the United States. Towers are developed for approx. $300K and space on the tower is leased to US telecom firms (Verizon, AT&T, T-Mobile). Tower Cash Flow (“TCF”) growth is driven by annual lease escalators, lease amendments due to equipment upgrades and adding additional telecom tenants to the tower. These towers are then sold to strategic buyers (American Tower, Crown Castle, SBA Communications) at 30 – 40x TCF. Historically Peppertree has generated a 1.89x net return on invested capital and a 16.6% net IRR.
The Real Estate Pool has allocated US $10 million to Peppertree Capital Fund IX (“PCF IX”) and as of December 31, 2023, 88.6% of this commitment has been called. During 2023, Peppertree called 50.1% of our commitment and through the first three quarters of 2023, PCF IX developed 486 towers, to bring the total number of towers built to 2,558. As of September 30, 2023, PCF IX has 1,491 cell towers under construction (up 308 from the end of 2022) and 798 pending acquisition (up 369 from the end of 2022).
Through December 31, 2023, PCF IX delivered an approx. 21.7% total return which contributed approx. 150 bps to the Real Estate Pool’s performance. PCF IX has now generated a net return on invested capital of 1.22x and our Net IRR is now 23.4% in the Real Estate Pool.
Exhibit 1 – Example of Modeled TCF Growth Over Extended Time Period

Source: Peppertree Capital.
Peppertree reports the demand for new towers continues to be driven by population growth, connected device growth, data-intensive application development and network evolution (from 4G to 5G). US telecom firms (Verizon, AT&T & T-Mobile) continue to offer unlimited data plans and free Apple products (iPhones, iPads and/or Apple Watches) to new subscribers, further increasing the utilization of their existing networks and driving demand for new cell towers. Further, the telecom firms are in the midst of upgrading their networks from 4G to 5G, which will make their networks faster and support more devices and more data.
For 2024, the expectation for PCF IX is for similar total returns to 2023 driven by additional tower development, annual contractual rent escalators, lease amendment rental gains and increased tenant intensity on existing towers.
For 2024, the expectation for PCF IX is for similar total returns to 2023 driven by additional tower development, annual contractual rent escalators, lease amendment rental gains and increased tenant intensity on existing towers.
Starlight Canadian Residential Growth Fund
Starlight Investments is the largest residential landlord in Canada with over 66,000 suites across Canada. Older apartment buildings are acquired and suites and building infrastructure are renovated to bring the building to a more modern and efficient standard. Historically Starlight Investments has generated a 25.0% gross IRR in this strategy and targets a 15.0 – 16.0% gross IRR, including a 4.0% annual cash distribution.
The Real Estate Pool has allocated CAD $10 million to Starlight Canadian Residential Growth Fund II (“SCRGF II”) and as of December 31, 2023, 100.0% of this commitment has been deployed. Through September 30, 2023, SCRGF II has acquired 5,532 suites and has invested $65.0 million to renovate 1,449 suites. These investments have generated 57.7% average rent growth and a 29.8% return on cost. Total value created by SCRGF II is now $312.6 million and the portfolio has appreciated to $1.8 billion in value.
During the first three quarters of 2023, Starlight Investments deployed $4.5 million in capex to reposition 278 more suites and resulted in value creation of $101.7 million. Through December 31, 2023,SCRGF II delivered an approx. 11.6% total return which contributed approx. 130 bps to the Real Estate Pool in 2023. Unrealized Gross IRR since inception is 12.9% and the Gross Equity Money Multiple is 1.3x.
The Real Estate Pool has allocated CAD $10 million to Starlight Canadian Residential Growth Fund III (“SCRGF III”) and as of December 31, 2023, 56.3% of this commitment has been deployed. Through September 30, 2023, SCRGF III has acquired 5,869 suites and has invested $18 million to renovate 783 suites. These investments have generated 43.0% average rent growth and a 31.0% return on cost. Total value created by SCRGF III is now $130 million and the portfolio has appreciated to $1.9 billion in value.
During the first three quarters of 2023, Starlight Investments deployed $12.6 million in capex to reposition 583 more suites and resulted in value creation of $101.7 million. Through December 31, 2023, SCRGF III delivered an approx. 12.7% total return which contributed approx. 150 bps to the Real Estate Pool in 2023. Over the next 12 months, SCRGF III is scheduled to deploy another $60.0 million of capex towards common areas, exteriors and building infrastructure. We expect similar returns from this capital deployment in 2024.
Exhibit 2 – Value-Add Capex Drives Rent Growth and Capital Appreciation

Source: Starlight Investments. Starlight Canadian Residential Growth Fund III Q3 2023 Quarterly. As of September 30, 2023.
Exhibit 3 - In-Suite Capex – Drives Rental Rates

Source: Starlight Investments. Starlight Canadian Residential Growth Fund II Q3 2023 Quarterly Update. As of September 30, 2023.
Canadian Mortgage & Housing Corporation (“CMHC”) estimates that by 2030 the housing shortage in Canada will reach 3.5 million homes. In their 2024 Rental Market Report, CMHC estimates that national apartment vacancy is at a record low 1.5%, which has led to 8.0% rent growth in 2023. SCRGFs II & III are primarily exposed to Toronto (1.4% vacancy) and Vancouver/ Victoria (0.9% vacancy) which have even lower vacancy and higher rent growth.
Declining interest rates in the second half of 2024 should bring cap rates down and provide valuation uplifts for the portfolio. Most of the debt in each portfolio has been refinanced into 40-year, amortizing mortgages with coupons below 4.0%. Both SCRGF II & III will continue to execute suite renovations and generate rent growth, supported by low supply and vacancy rates. We anticipate both SCRGF II & III will deliver similar returns in 2024 as they did in 2023.
Prologis Targeted US Logistics Fund
Prologis Inc. (“Prologis”) is the largest global industrial landlord with ~1.2 billion square feet (“SF”) of real estate across 19 countries. Every year 2.8% of global GDP passes through Prologis’ warehouses as the portfolio contains 5,613 buildings that serve 6,700 customers. Prologis’ portfolio is focused on newer distribution, logistics and warehouse assets in coastal tier one markets that serve global customers. Since inception, the Prologis Targeted US Logistics Fund (“USLF”) has generated a 13.0% Net IRR, including a 5.9% Gross Yield.
The Real Estate Pool has allocated US $15 million to USLF and as of December 31, 2023, 100% of this capital has been deployed. USLF has grown to US $24.8 billion of AUM, of which 26.2% is Prologis Inc.’s investment. The portfolio of 744 buildings and 124.1 million SF sits across 28 US markets. Occupancy is currently 96.6% and of the 15.0% of leases that renewed in 2023, the average mark-to-market on deals signed was 82.9% and is still rising quarter-over-quarter. The loan-to-value on the portfolio is down to 17.7% (target 20 – 40%) with a weighted average cost of 4.0% and a weighted average years to maturity of 7.7. In addition, 85.8% of USLF’s debt is fixed rate and 99.5% of assets are unencumbered (i.e. USLF used unsecured debentures, not mortgage debt).
Through December 31, 2023, USLF generated a -13.0% total return which reduced the Real Estate Pool’s total return by approx. -345 bps. For 2023, Prologis reports that rising interest rates have pushed both cap rates and expected investor IRRs significantly higher, sending valuations down. All of USLF’s assets are appraised by a rotating cast of global commercial real estate services firms (i.e. CBRE, Colliers, JLL, etc.) every quarter. As a result of the frequency of appraisals and the rapidity of the rate hike cycle, USLF underperformed the NPI-Industrial Benchmark by -600 bps in 2023.
New industrial development contributed to a supply surge and general weakness in industrial appraised values. In December 2022, 742.3 million square feet of new supply was under construction in the US, representing 3.8% of existing stock. This surge of new supply slowed rent growth to 7.4% in 2023 and drove vacancy up to 4.6% nationally. Much of this new supply has been absorbed and in December 2023 new supply had fallen to 462.9 million square feet and 2.4% of existing stock. Construction costs remain high (materials, labour, financing) and that is contributing to the decline in development starts (all speculative development has ceased). USLF anticipates that vacancy will peak in the first half of 2024 and begin to decline in the fourth quarter.
Exhibit 4 – Operating Fundamentals, U.S.

Source: Prologis Targeted U.S. Logistics Fund, L.P. Quarterly Report. Q4 2023.
For 2024, USLF management has unveiled an impressive business plan that supports their forecast of a 10.6% gross total return (6.3% capital appreciation and 4.1% distribution yield). USLF’s 2024 Business Plan is summarized as follows:
- Drive 10% Net Operating Income (“NOI”) growth
- Capitalize on market repricing of asset
- Improve liquidity and reduce leverage
Exhibit 5 – Net Effective Rent (“NER”) Change

Source: Prologis Targeted U.S. Logistics Fund, L.P. Quarterly Report. Q4 2023.
USLF has a 7.8 million SF pipeline of stabilized assets to acquire from Prologis which should result in $1 billion of accretive acquisitions in 2024. USLF is also negotiating to purchase $215 million of third-party core and value-add assets to further drive growth. USLF also has $329 million of fully-valued assets it is looking to sell to fund some of these acquisitions. This net ~$1 billion of accretive acquisitions should further drive positive growth in 2024.
From a leverage standpoint, only 3.1% of the debt is maturing in 2024 (zero debt maturing in 2025) at a 3.9% average interest rate. USLF will likely retire this debt to keep total leverage below their 20% - 40% target range while rates are elevated. USLF is targeting $1 billion in equity capital fundraising in 2024 to further reduce leverage.
While the fundamentals of US industrial real estate are very strong and we believe USLF’s management team has a sound business plan, we have chosen to reduce our exposure to USLF. We will continue to monitor this position and are prepared to add to this position should the business plan bear fruit, or completely exit our position should the negative performance persist.
Unison Midgard Fund
Unison Midgard Fund (“Unison”) is an open-end fund that generates returns via equity investments in single family homes across the United States. Historically US home prices have appreciated 5.0% on average over the last 50 years while the homes Unison has invested in have historically outperformed this by ~170 bps. Due to the operational leverage (NOT financial leverage) in Unison’s contracts, Unison has generated on average a 14.5% total return when US homes have appreciated by 5.0%. Since inception, Unison has generated a 20.5% Net IRR.
The Real Estate Pool has allocated ~$27 million to Unison Midgard Fund and as of December 31, 2023, 100% of this capital has been deployed. Unison has grown to US $962.9 million in investments secured to real estate with a value of US $3.8 billion. Realizations (property sales or property refinancings) in Q3 2023 generated average gains of 66.0% and an overall IRR of 18.0% on the realized investments. As of September 30, 2023, the Unison portfolio continues to improve in quality as the average home value has risen to US $497,000 (US average is $417,700) with an average Unison investment of US $73,500.
Exhibit 6 – Unison Midgard Fund Details

Source: Unison Investment Management, as of September 30, 2023.
In 2023 Unison generated a small negative total return which reduced the Real Estate Pool’s total return by less than 10 bps. Unison’s return in 2023 was impacted by the lag in its valuation model, securitizations, market mix and currency. All of these factors are discussed in depth in our standalone piece about Unison, which includes our 2024 outlook for Unison.
The outlook for home price appreciation in the markets that Unison has exposure to is appox. 3.6%, compared to the national home price appreciation outlook of approx 2.5%). Historically, this level of home price appreciation has yielded attractive absolute total returns for Unison.
The outlook for home price appreciation in the markets that Unison has exposure to is appox. 3.6%, compared to the national home price appreciation outlook of approx 2.5%). Historically, this level of home price appreciation has yielded attractive absolute total returns for Unison.
Exhibit 7 – Unison Portfolio Composition: Geographical Footprint

Source: Unison Midgard Fund LP. Investor Quarter-End Report. As of September 30, 2023.
Exhibit 8 – Housing Prices Surpass June 2022 All-Time High
Home Prices Have Rebounded
Home Prices Have Rebounded

Source: Unison Midgard Fund LP. Investor Quarter-End Report. As of September 30, 2023.
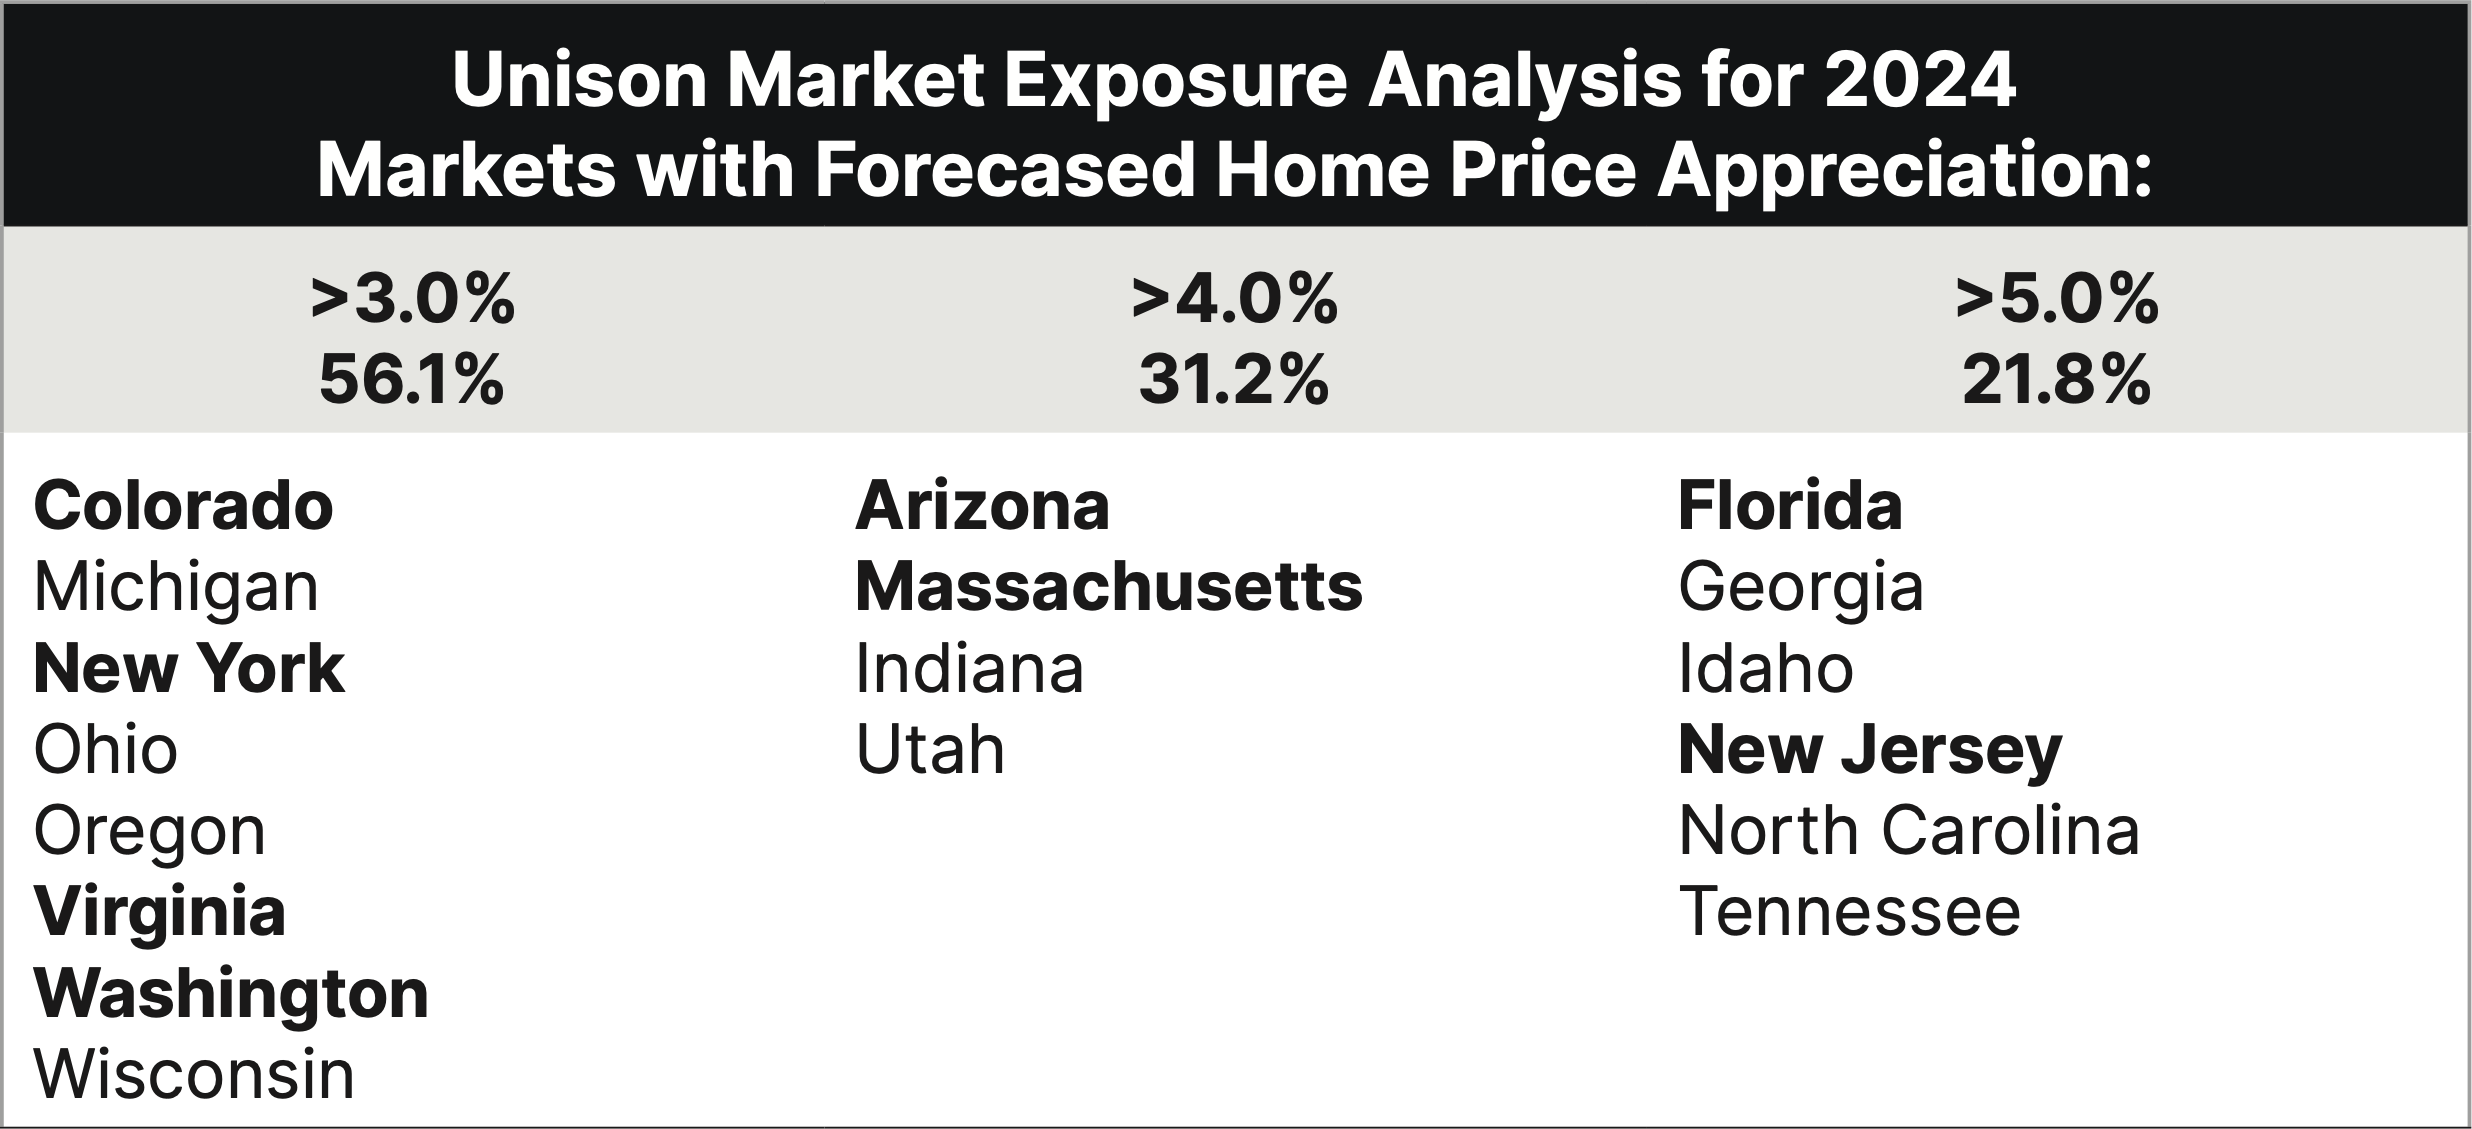
For 2024, 56.1% of Unison’s markets are forecast to have home price appreciation of 3.0% or better, 31.2% are at 4.0% or better and 21.8% are at 5.0% or better. In the chart below, top 10 markets for Unison are bolded to demonstrate Unison’s leverage to these top performing markets. Unison has zero exposure to US markets that are forecast to have negative returns in 2024 (Arkansas, Louisiana, Mississippi and North Dakota) so market mix should be a positive contributor total returns in 2024.
Exhibit 9 – Unison Market Exposure Analysis for 2024
Source: Unison Investment Management, as of September 30, 2023.
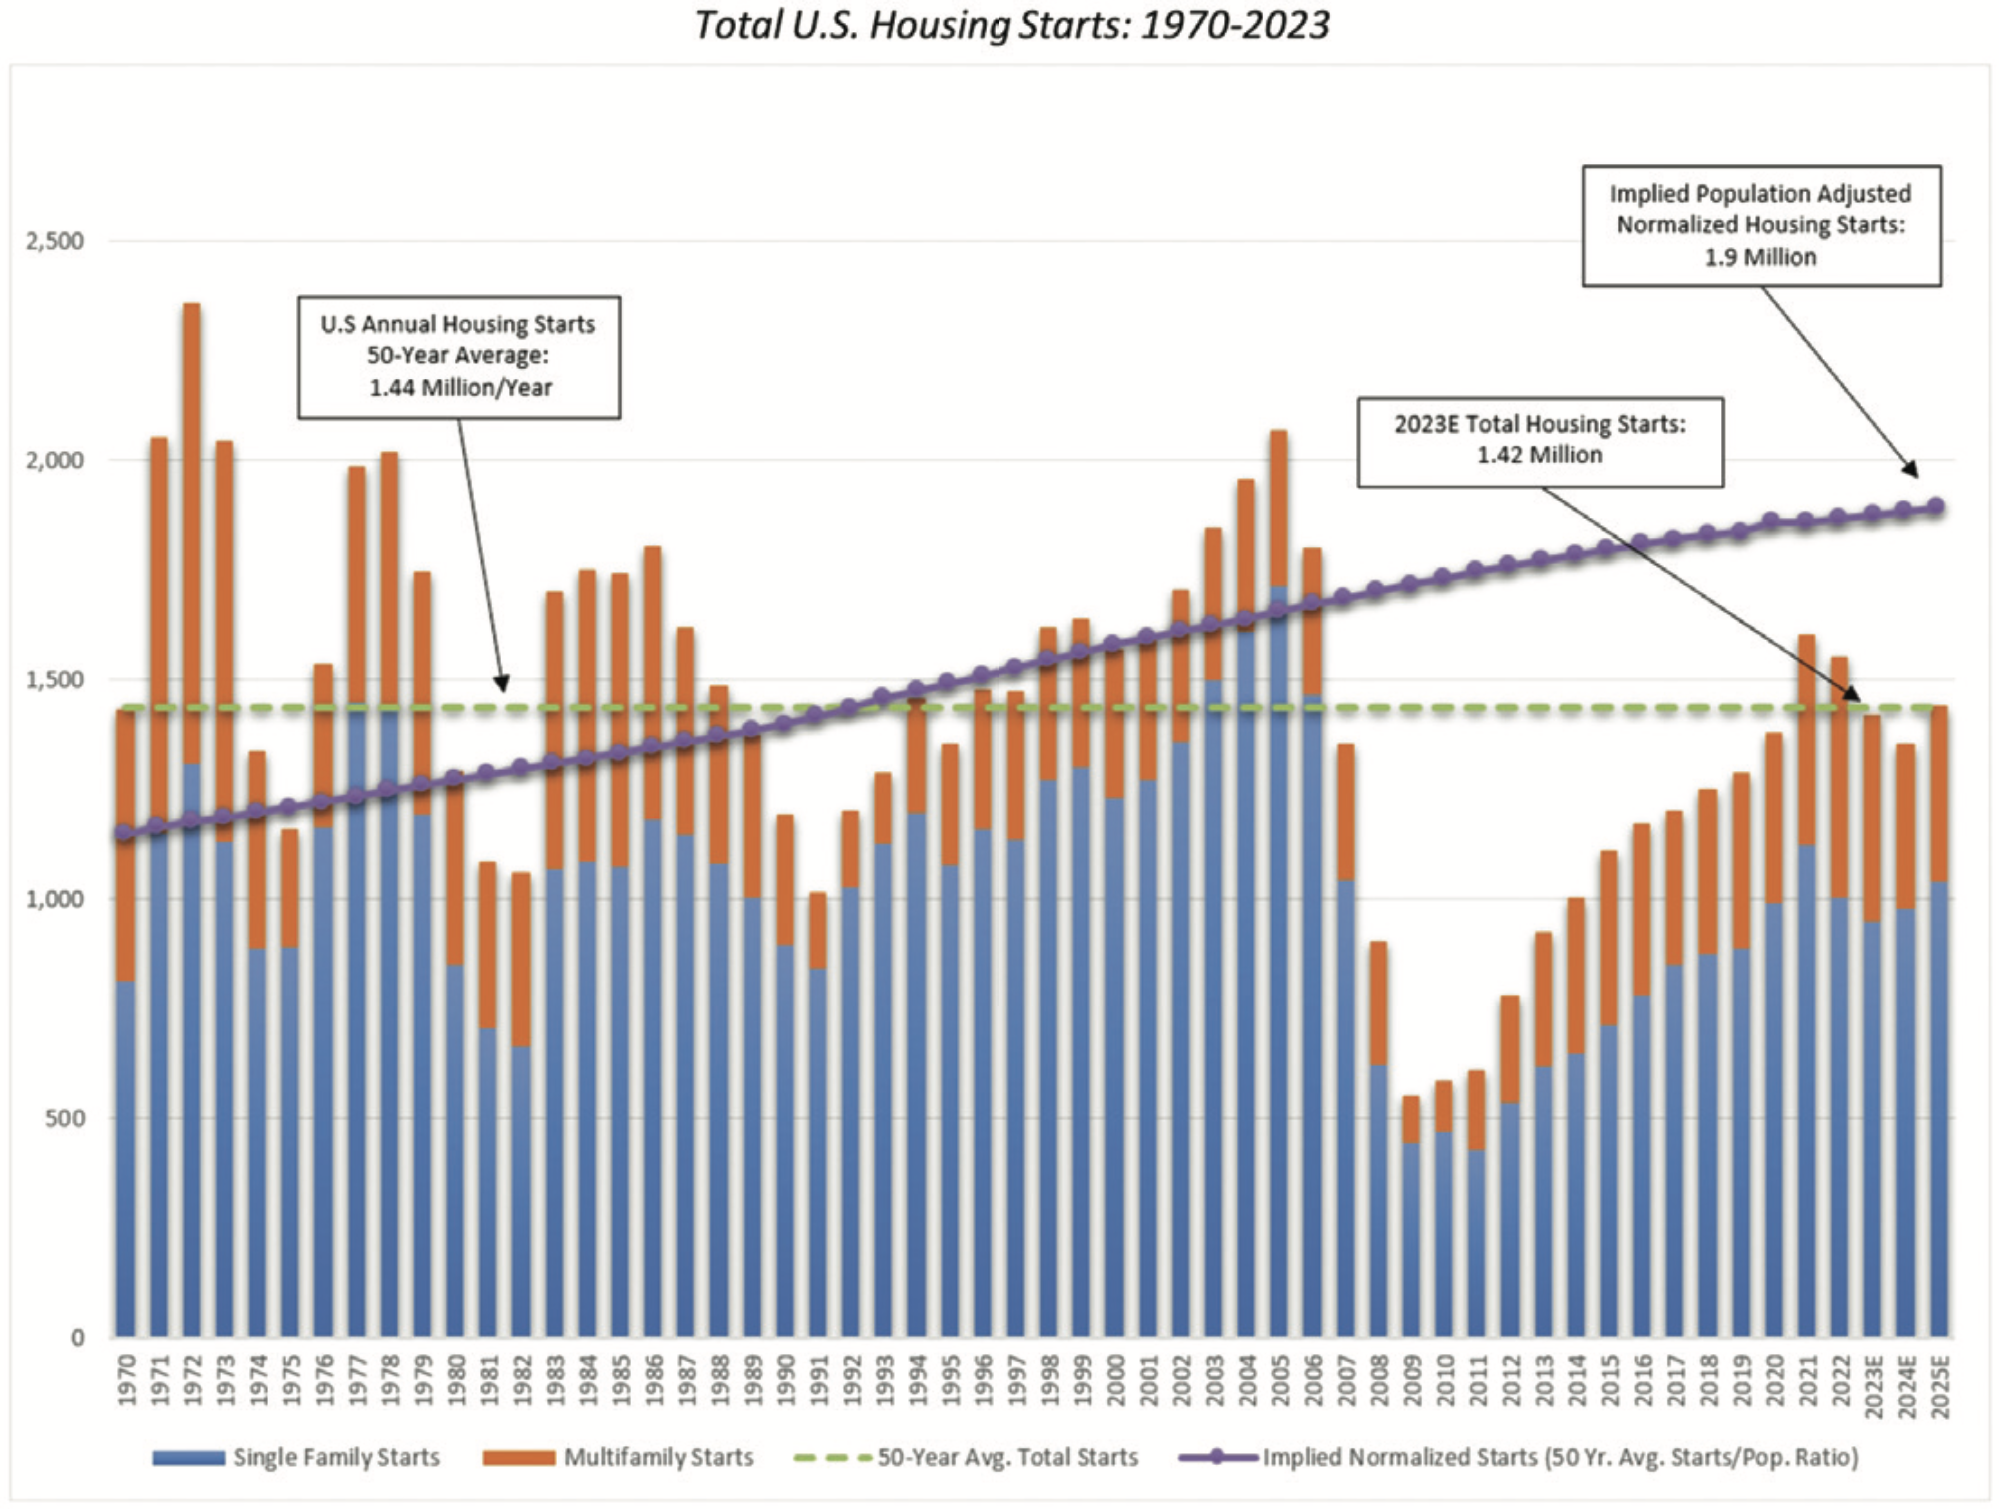
Looking at the drivers of the US housing market, we find that almost all of them are either supportive of higher prices or improving in that regard. As the chart below demonstrates, US home starts have averaged 1.44 million for the last 50 years. Since the global financial crisis, the US has under-invested in single family homes to the point that the US is now short 1.7 million homes. That deficit is forecast to increase again in 2024 as 1.35 million projected home starts falls below the long-term average and the updated 1.9 million run rate of starts required to bridge the deficit over time.
Exhibit 10 – Single-Family Supply Deficit Only Growing More Severe
Source: U.S. Census Bureau; Raymond James Research.
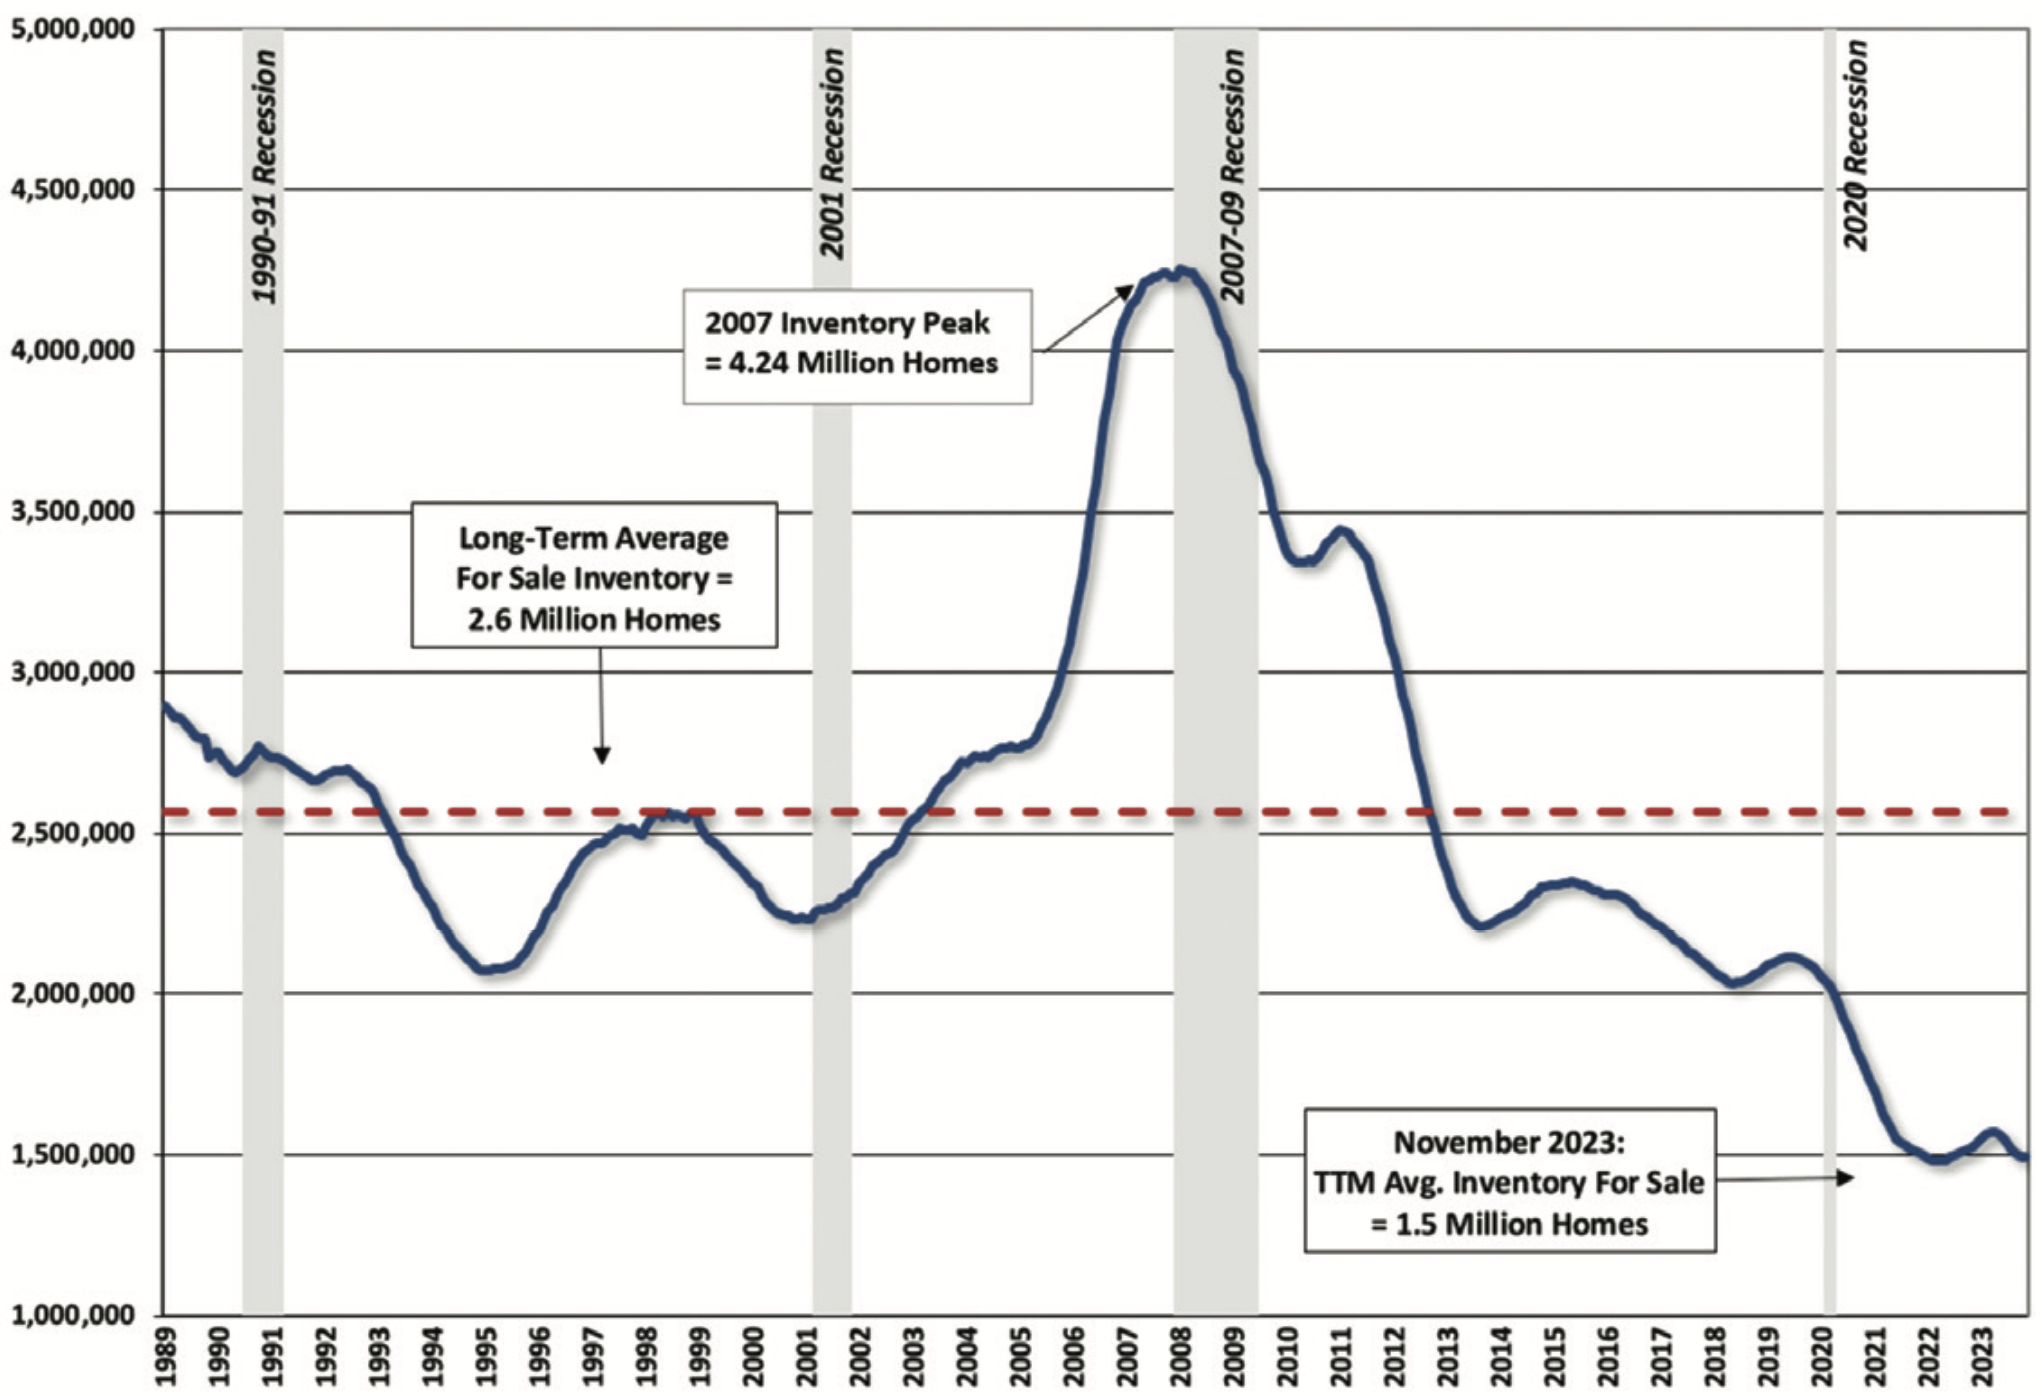
Exhibit 11 – Total Combined For-Sale Inventory: 1989-2023
(Existing Home Listings and New Homes for Sale)
(Existing Home Listings and New Homes for Sale)
Source: National Association of Realtors, U.S. Census Bureau, Raymond James research.
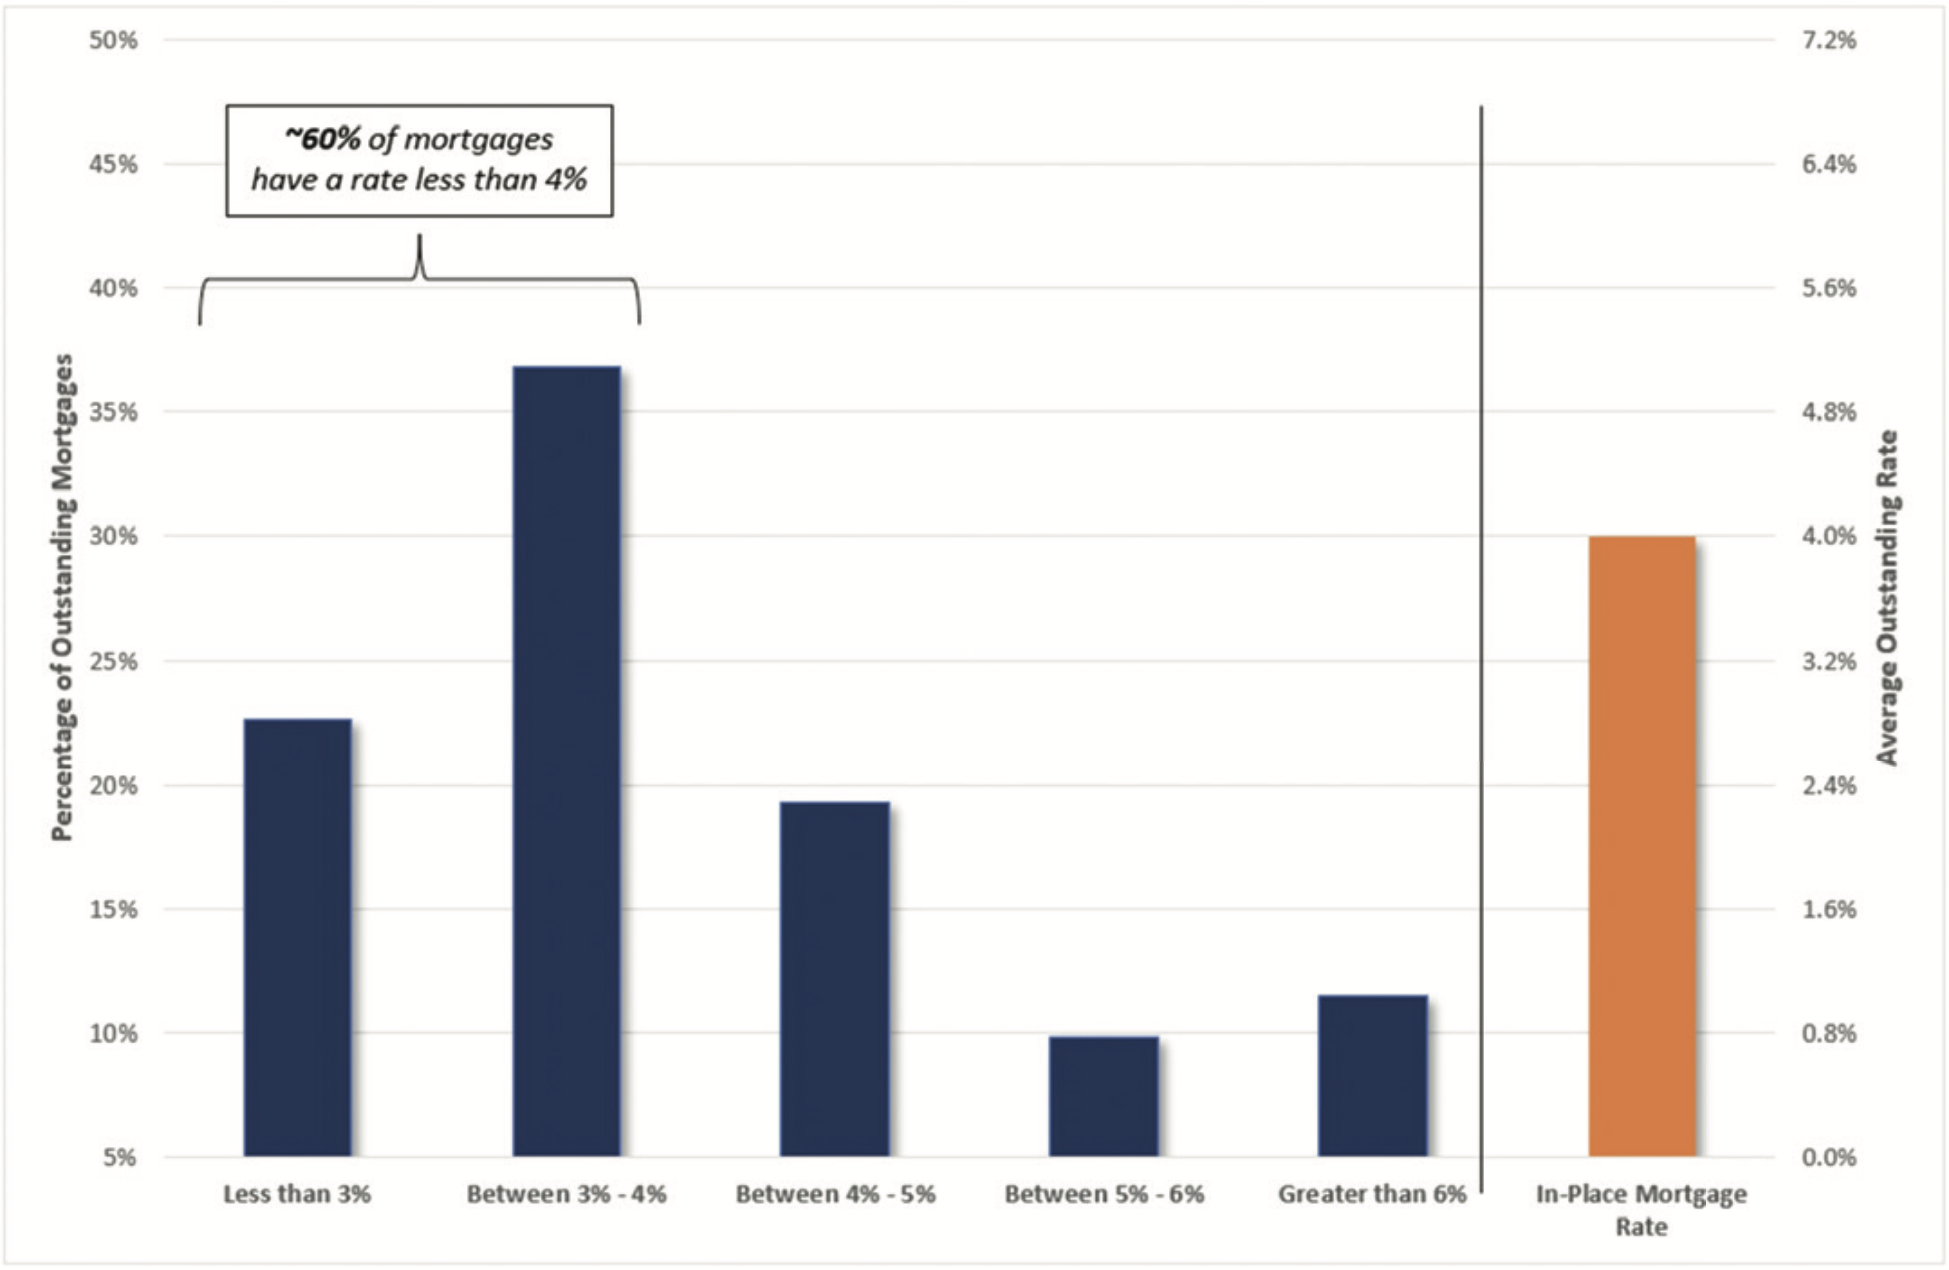
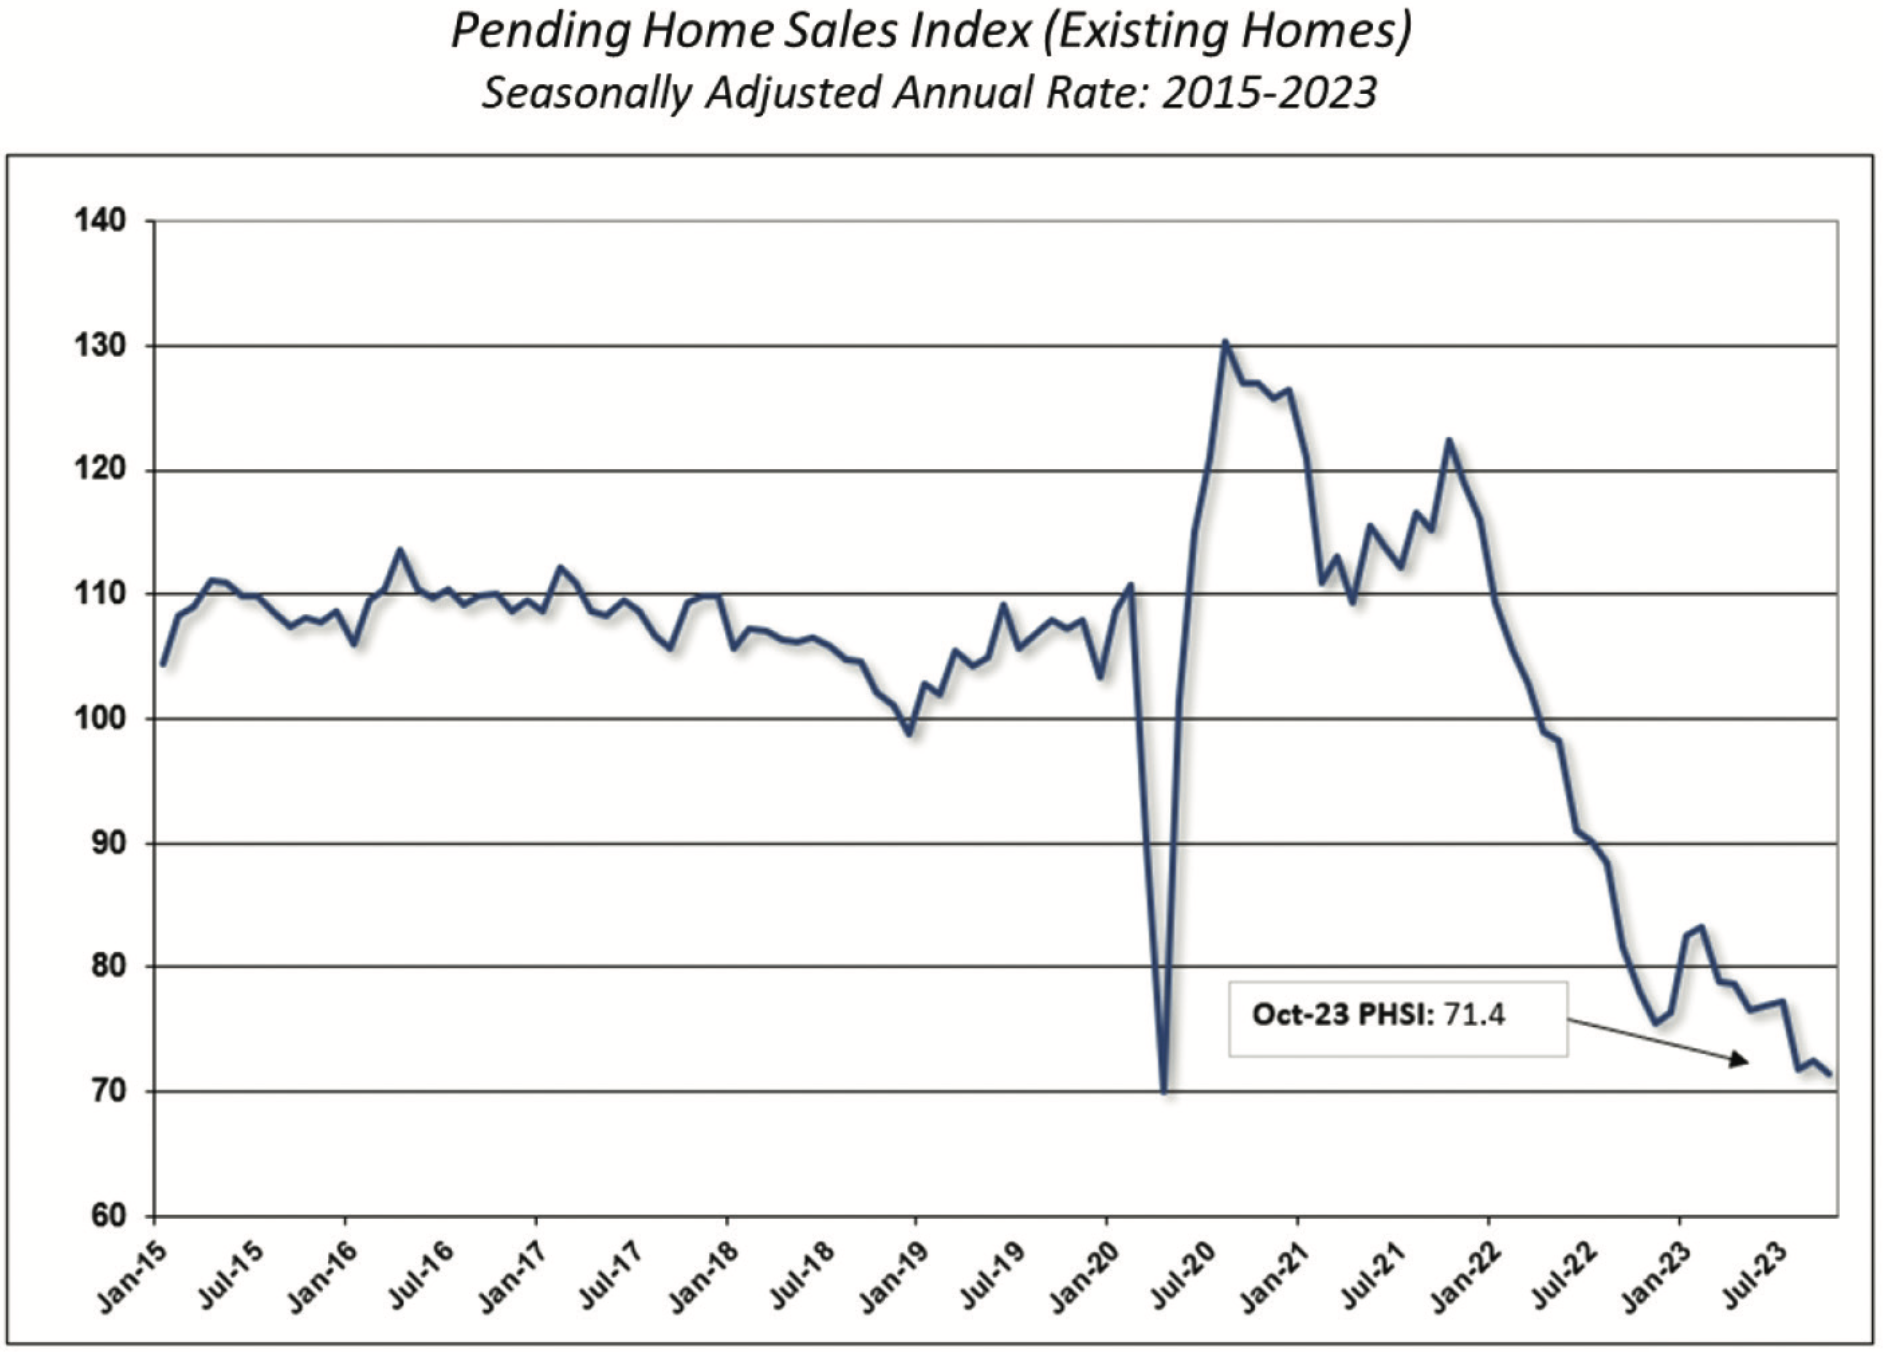
Much has been made of the “lock-in effect” created by a significant increase in the 30-year mortgage rate over a short period of time. Existing-home sales have fallen to their slowest pace in more than a decade as homeowners choose to remain in their current homes in order to keep their low mortgage rates. As the chart below indicates, approximately 60.0% of US home mortgages are at a rate that is below 4.0%, compared to the current 30-year mortgage rate of 6.6%. As a consequence, pending home sales of existing homes are near their all-time low.
Exhibit 12 – “Lock-In Effect” Not Going Away Any Time Soon
In-Place Mortgage Rates on Loans Outstanding (As of September 2023)
In-Place Mortgage Rates on Loans Outstanding (As of September 2023)
Source: FHFA National Mortgage Database, and Raymond James Research.
Exhibit 13 – Pending Homes Sales Index (Existing Homes)
Source: National Association of Realtors, Raymond James research.
To summarize, Unison’s markets appear poised to deliver strong home price appreciation in 2024. US housing market fundamentals (low supply, rising demand, high owners’ equity, declining mortgage rates, strong labour market) remain very strong and we are entering the seasonally strong period for the US housing market.
2024 Starlight Private Global Real Estate Pool Outlook
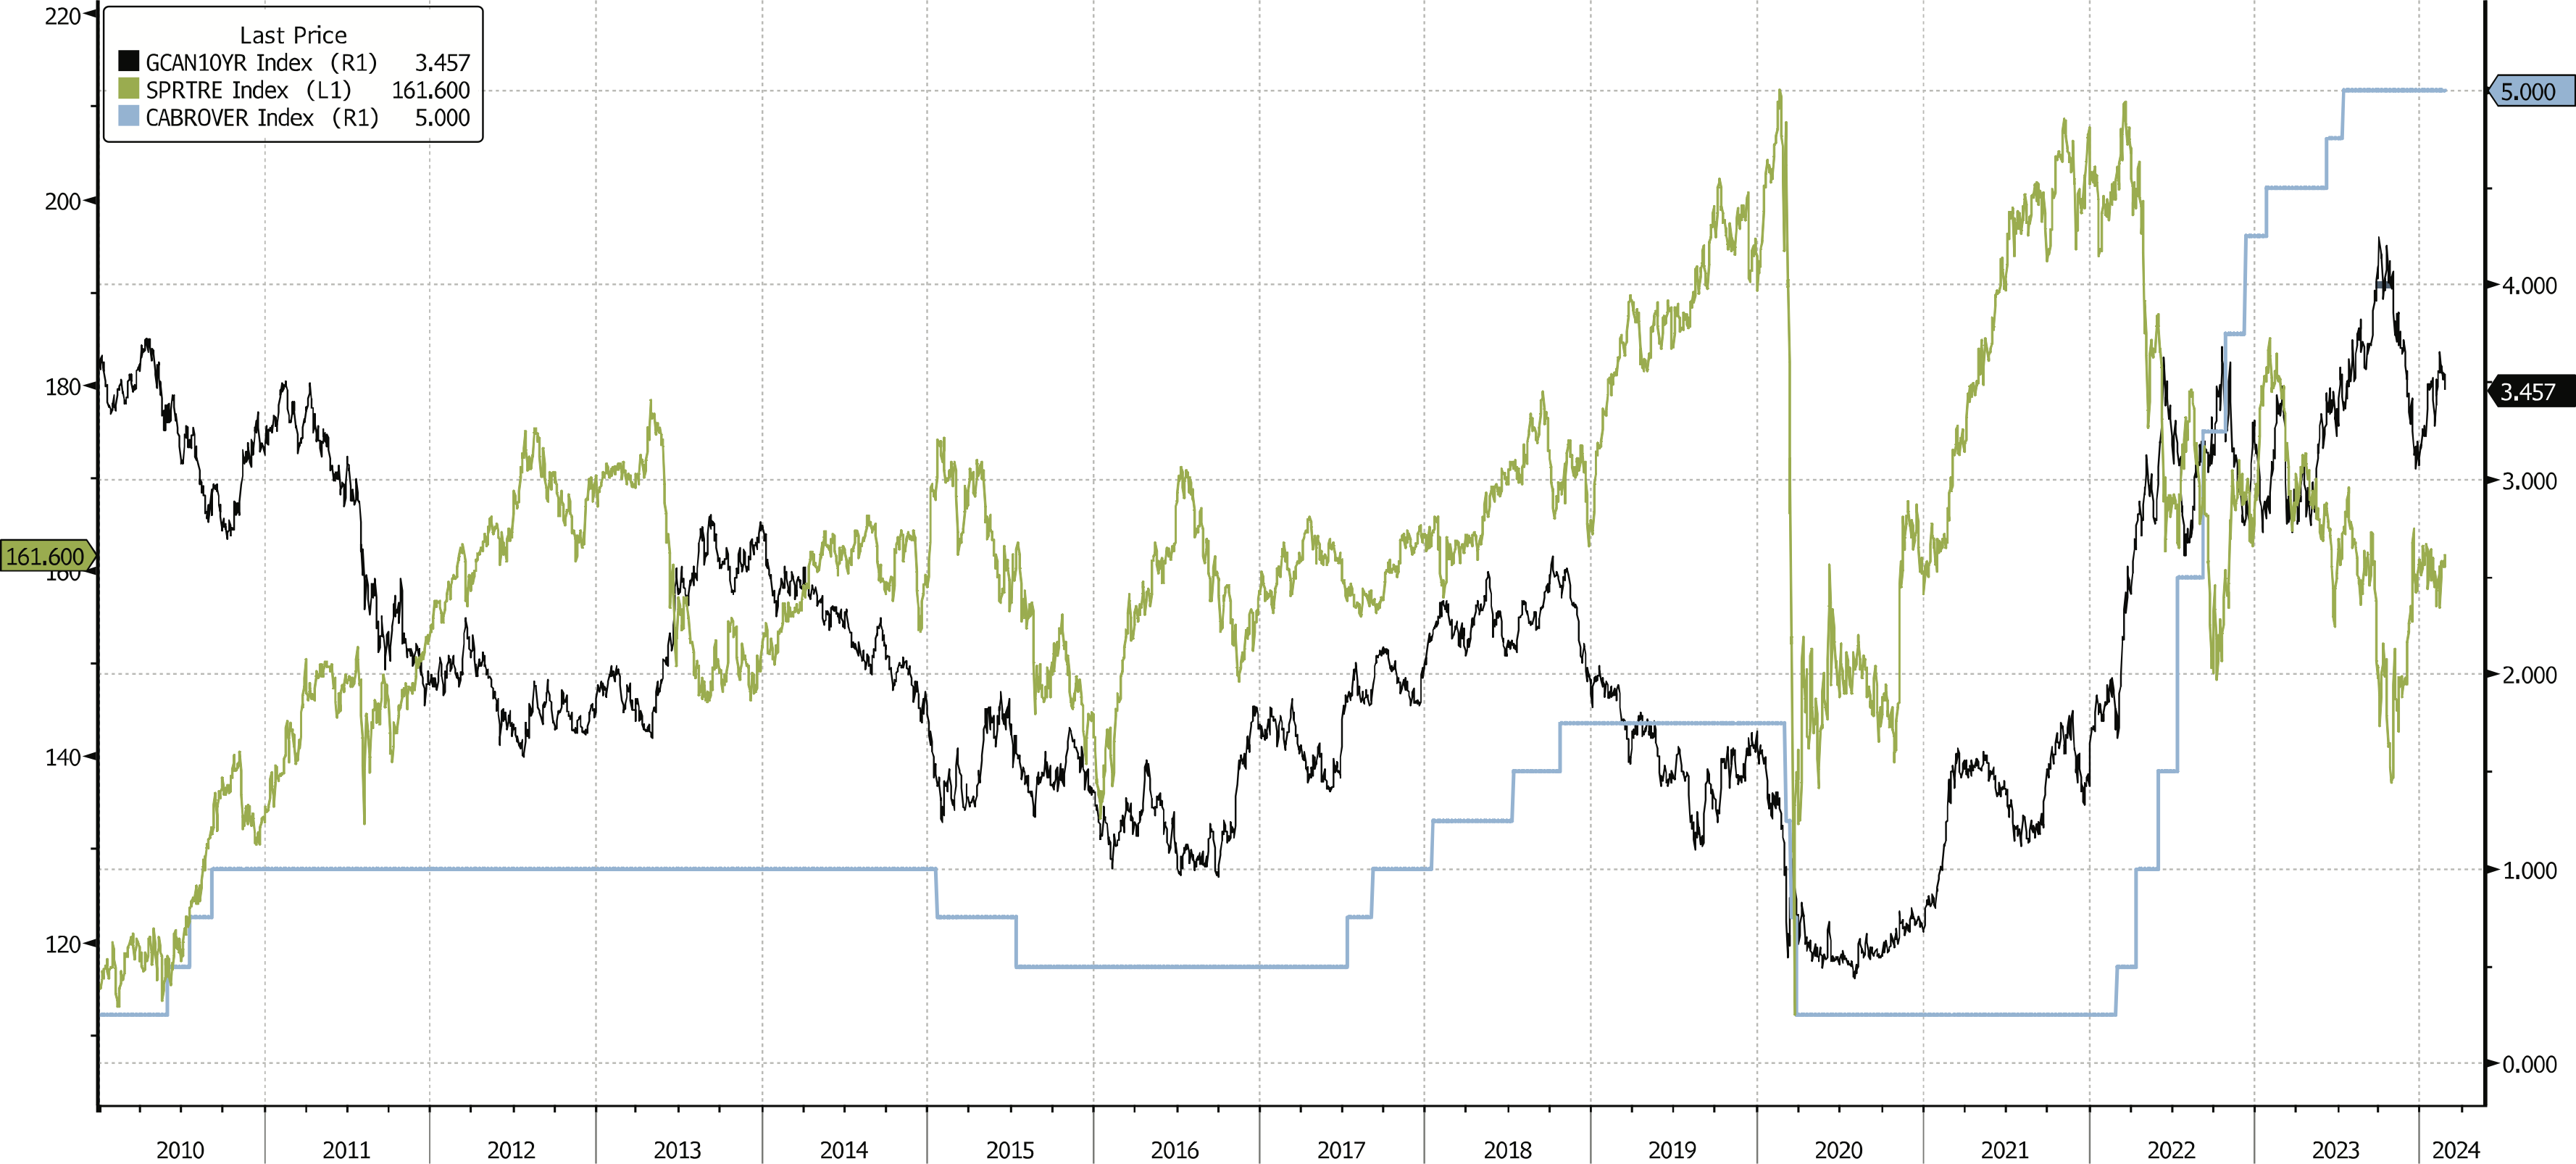
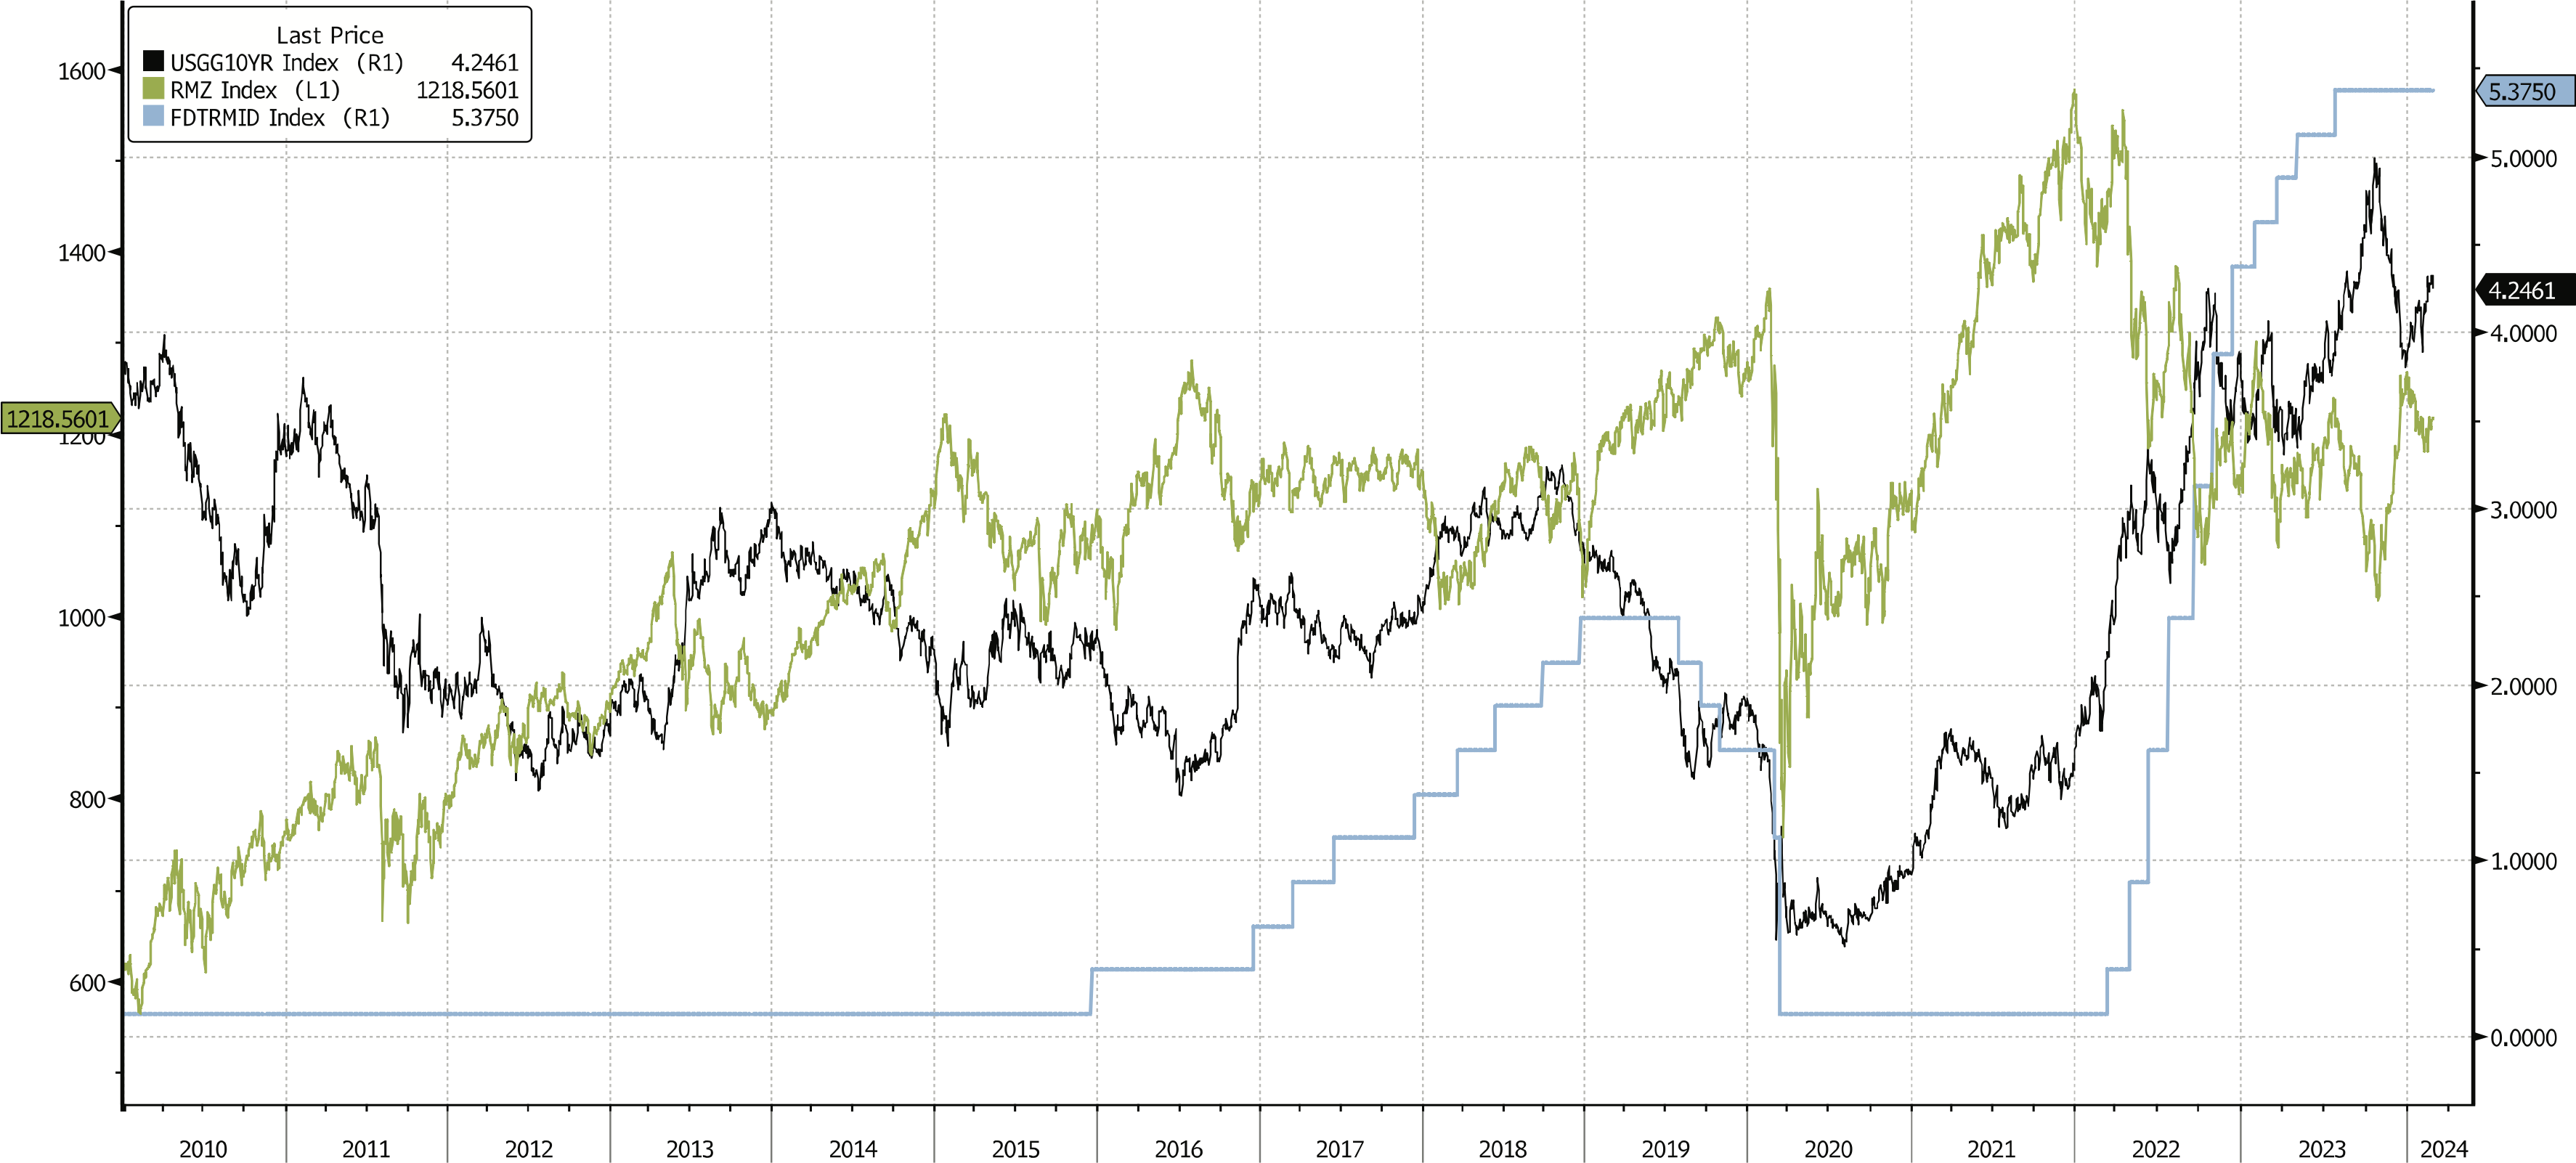
Much of the underperformance of private global real estate in 2023 was driven by a synchronized global central bank hiking cycle from 2022 to 2023. These hiking cycles have ended, and central banks have indicated they will commence cutting policy rates in 2024. This has historically resulted in strong performance of real estate assets and REITs.
Exhibit 14 – Canadian Interest Rates and REIT Performance
Source: Bloomberg Finance L.P.
Exhibit 15 – US Interest Rates and REIT Performance
Source: Bloomberg Finance L.P.
The market has moved from pricing in six rate cuts in 2024 to pricing in three rate cuts, with the US dollar strengthening in response. We expect the Bank of Canada to cut rates sooner and by more than the Federal Reserve Bank, creating additional Canadian dollar weakness versus the US dollar.
The asset allocation of the Starlight Private Global Real Estate Pool should allow it to return to generating strong absolute performance in 2024:
- Value-add Canadian apartments
- Strong housing market fundamentals in the US
- Strong industrial market fundamentals in the US
- Data driven demand for more cell tower development in the US
The Real Estate Pool has no exposure to office or retail assets and has no exposure to emerging markets. All of our private real estate partners employ conservative leverage strategies and generate significant free cash flow from operations.
As we approach our six-year anniversary as a firm and the four-year anniversary of the Starlight Private Global Real Estate Pool, we appreciate the support you have shown us. We appreciate the opportunity to compete for your client’s capital and the Starlight Private Pools have played a significant role in our combined success.
Sincerely,
The Starlight Capital Team
We invite you to partner with us.
Starlight Private Global Real Estate Pool
Starlight Private Global Real Estate Pool
Innovative Fund Structure
Access a diversified portfolio of best-in-class private investment partners managing institutional-quality, private real estate.
Access a diversified portfolio of best-in-class private investment partners managing institutional-quality, private real estate.

Real Assets
Starlight Private Global Real Estate Pool
Inception-2020
Investment Objective:
To achieve long-term capital appreciation and regular current income by investing globally in private real estate investments and in public real estate investment trusts (REITs) and equity securities of corporations participating in the residential and commercial real estate sector.
Fund Codes
Series A (SLC1101)
Series F (SLC1201)
Series I (SLC1901)
Distribution Frequency
Fixed Quarterly
Important disclaimer.
The views in this update are subject to change at any time based upon market or other conditions and are current as of February 22, 2024. While all material is deemed to be reliable, accuracy and completeness cannot be guaranteed.
Certain statements in this document are forward-looking. Forward-looking statements (“FLS”) are statements that are predictive in nature, depend upon or refer to future events or conditions, or that include words such as “may,” “will,” “should,” “could,” “expect,” “anticipate,” “intend,” “plan,” “believe,” or “estimate,” or other similar expressions. Statements that look forward in time or include anything other than historical information are subject to risks and uncertainties, and actual results, actions or events could differ materially from those set forth in the FLS. FLS are not guarantees of future performance and are by their nature based on numerous assumptions. Although the FLS contained herein are based upon what Starlight Capital and the portfolio manager believe to be reasonable assumptions, neither Starlight Capital nor the portfolio manager can assure that actual results will be consistent with these FLS. The reader is cautioned to consider the FLS carefully and not to place undue reliance on FLS. Unless required by applicable law, it is not undertaken, and specifically disclaimed that there is any intention or obligation to update or revise FLS, whether as a result of new information, future events or otherwise.
Commissions, trailing commissions, management fees and expenses all may be associated with investment funds. Please read the prospectus before investing. Investment funds are not guaranteed, their values change frequently, and past performance may not be repeated. The content of this document (including facts, views, opinions, recommendations, descriptions of or references to, products or securities) is not to be used or construed as investment advice, as an offer to sell or the solicitation of an offer to buy, or an endorsement, recommendation or sponsorship of any entity or security cited. Although we endeavour to ensure its accuracy and completeness, we assume no responsibility for any reliance upon it. Please read the offering documents before investing. Investors should consult with their advisors prior to investing. Starlight Investments, Starlight Capital and all other related Starlight logos are trademarks of Starlight Group Property Holdings Inc.
Starlight Investments Capital LP (“Starlight Capital”) is the manager of the Starlight Private Global Real Estate Pool, the Starlight Private Global Infrastructure Pool, and the Starlight Global Private Equity Pool (“Starlight Private Pools”). Starlight Private Pools are offered only to “accredited investors” or in reliance on another exemption from the prospectus requirement.
