The Case for Global Infrastructure
The infrastructure sector generally encompasses investments in the underlying networks and services that are essential for the proper functioning of global economies. Historically this has included transportation, energy & utilities, communications and social infrastructure businesses. While the nature of the businesses may differ greatly, there are several common factors which link the businesses and qualify them as infrastructure.
As an asset class, infrastructure is traditional divided between economic and social types of investments.
Types of infrastructure investments
| Economic Infrastructure | Social Infrastructure | ||
|---|---|---|---|
| Transport | Energy & Utilities | Communications | Social |
|
|
|
|
Source: Credit Suisse Asset Management
Additional Information
8 reasons for investing in infrastructure
High Barriers to Entry
Many infrastructure assets operate as government-regulated monopolies. Utility services providing drinking water or electricity are “mission critical” and the demand for these services is largely inelastic across the business cycle. The exorbitant cost of duplicating water pipes, transmission lines, etc. mean that the public is best served by one provider operating under public oversight.Some infrastructure assets enjoy high barriers to entry as a result of the assets they have acquired or the structure of their industry. International airports enjoy high barriers to entry due to the rapidly declining marginal benefit of building a second large airport in a city. Similarly, the North American freight railroad industry has consolidated into eight large carriers with little prospect of another competing railroad emerging.
Freight Railroads in North America

Pricing Power
Because of the relatively inelastic demand for their services, infrastructure assets usually have the ability to consistently increase prices over time. Toll road operators usually have annual escalators built into their concessions, which allow them to raise tolls by inflation plus a margin. Regulated utilities often have a regulated capital and return structure that allows them to earn a return on assets and investment that exceeds the rate of inflation. The ability to consistently raise prices ensures that the growth in absolute cash flow and distributions from the asset matches or exceeds inflation.
Transurban Group
Tolling Escalation - Embedded Inflation Protection
| MOTORWAY | ESCALATION |
|---|---|
| CityLink | Escalated quarterly by the greater of quarterly CPI or 1.011065% per quarter for the first 16 years (until 31 December 2016), then quarterly by CPI. This is subject to a cap of annual CPI plus 25%, which cannot be exceeded. |
| M2 | Escalated quarterly by the greater of quarterly CPI or 1%. |
| LCT | Escalated quarterly by quarterly CPI. The toll cannot be lowered as a result of deflation, however, until inflation counteracts the deflation the toll cannot be increased. |
| ED | Escalated quarterly by quarterly by the greater of a weighted sum of quarterly AWE and quarterly CPI or 1%. |
| M7 | Escalated or de-escalated quarterly by quarterly CPI. |
| M5 | Escalated quarterly by quarterly Sydney CPI. The toll cannot be lowered as a result of deflation, however, until inflation counteracts the deflation the toll cannot be increased. |
| CCT | Escalated quarterly by: the greater of quarterly CPI or 0.9853% (equivalent to 4% per annum) to June 2012; the greater of quarterly CPI or 0.7417% (equivalent to 3% per annum) to June 2018; quarterly CPI to concession end. |
| Logan Motorway | Tolls escalate annually at Brisbane CPI. The toll cannot be lowered as a result of deflation. |
| Gateway Motorway | Tolls escalate annually at Brisbane CPI. The toll cannot be lowered as a result of deflation. |
| Clem7 | Tolls escalate annually at Brisbane CPI. The toll cannot be lowered as a result of deflation. |
| Go Between Bridge | Tolls escalate annually at Brisbane CPI. The toll cannot be lowered as a result of deflation. |
| Legacy Way | Tolls escalate annually at Brisbane CPI. The toll cannot be lowered as a result of deflation. |
| AirportlinkM7 | Tolls escalate annually at Brisbane CPI. The toll cannot be lowered as a result of deflation. |
| 495 Express Lanes | Dynamic, uncapped. |
| 95 Express Lanes | Dynamic, uncapped. |
Predictable Cash Flows
Infrastructure assets tend to be very long-lived assets with high development costs but relatively low operating costs. Combined with the inelastic demand pattern and pricing power, the result is a very consistent, long term cash flow stream. Consider the construction of toll roads, transmission and distribution networks and telecom networks. These infrastructure assets have useful lives of 30 to 50 years, during which they produce consistent cash flows for investors.
WEC Energy Group
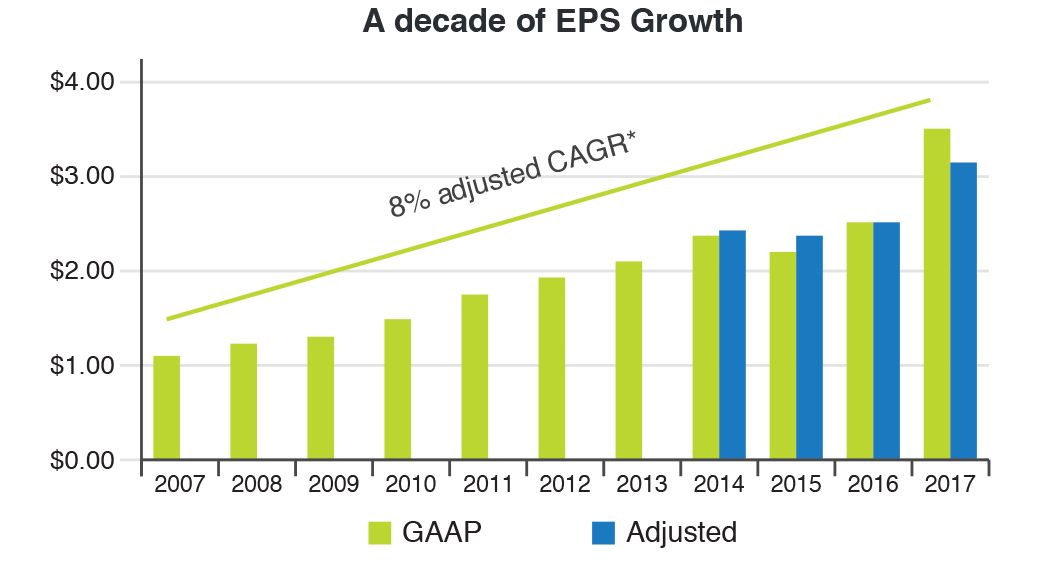
* 10% CAGR based off GAAP EPS that include a one-time, non-cash gain related to the Tax Cut and Jobs Act of 2017. Source: WEC Energy Group, Investor Update, April 2018
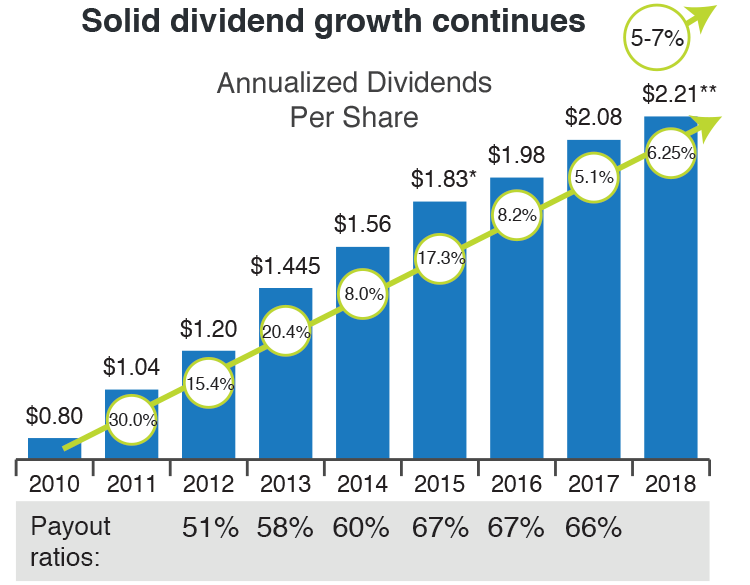
*Annualized based on fourth quarter 2015 dividend of $0.4575
**Annualized based on 1st quarter 2018 dividend of $0.5525
**Annualized based on 1st quarter 2018 dividend of $0.5525
Sustainable Long-Term Growth
In addition to consistent, long term cash flow, most infrastructure assets also provide consistent growth to investors. Infrastructure utilization is often driven by factors such as population growth, demographic trends, absolute economic expansion and macro trends. These long term, secular drivers tend to make infrastructure assets more valuable over time as they drive utilization rates higher. Telecom towers are a perfect example of an asset whose utilization is driven by population growth and innovation. As smart phones proliferate and data traffic climbs, telecom network utilization rises, making it more valuable.
America Tower Corp1
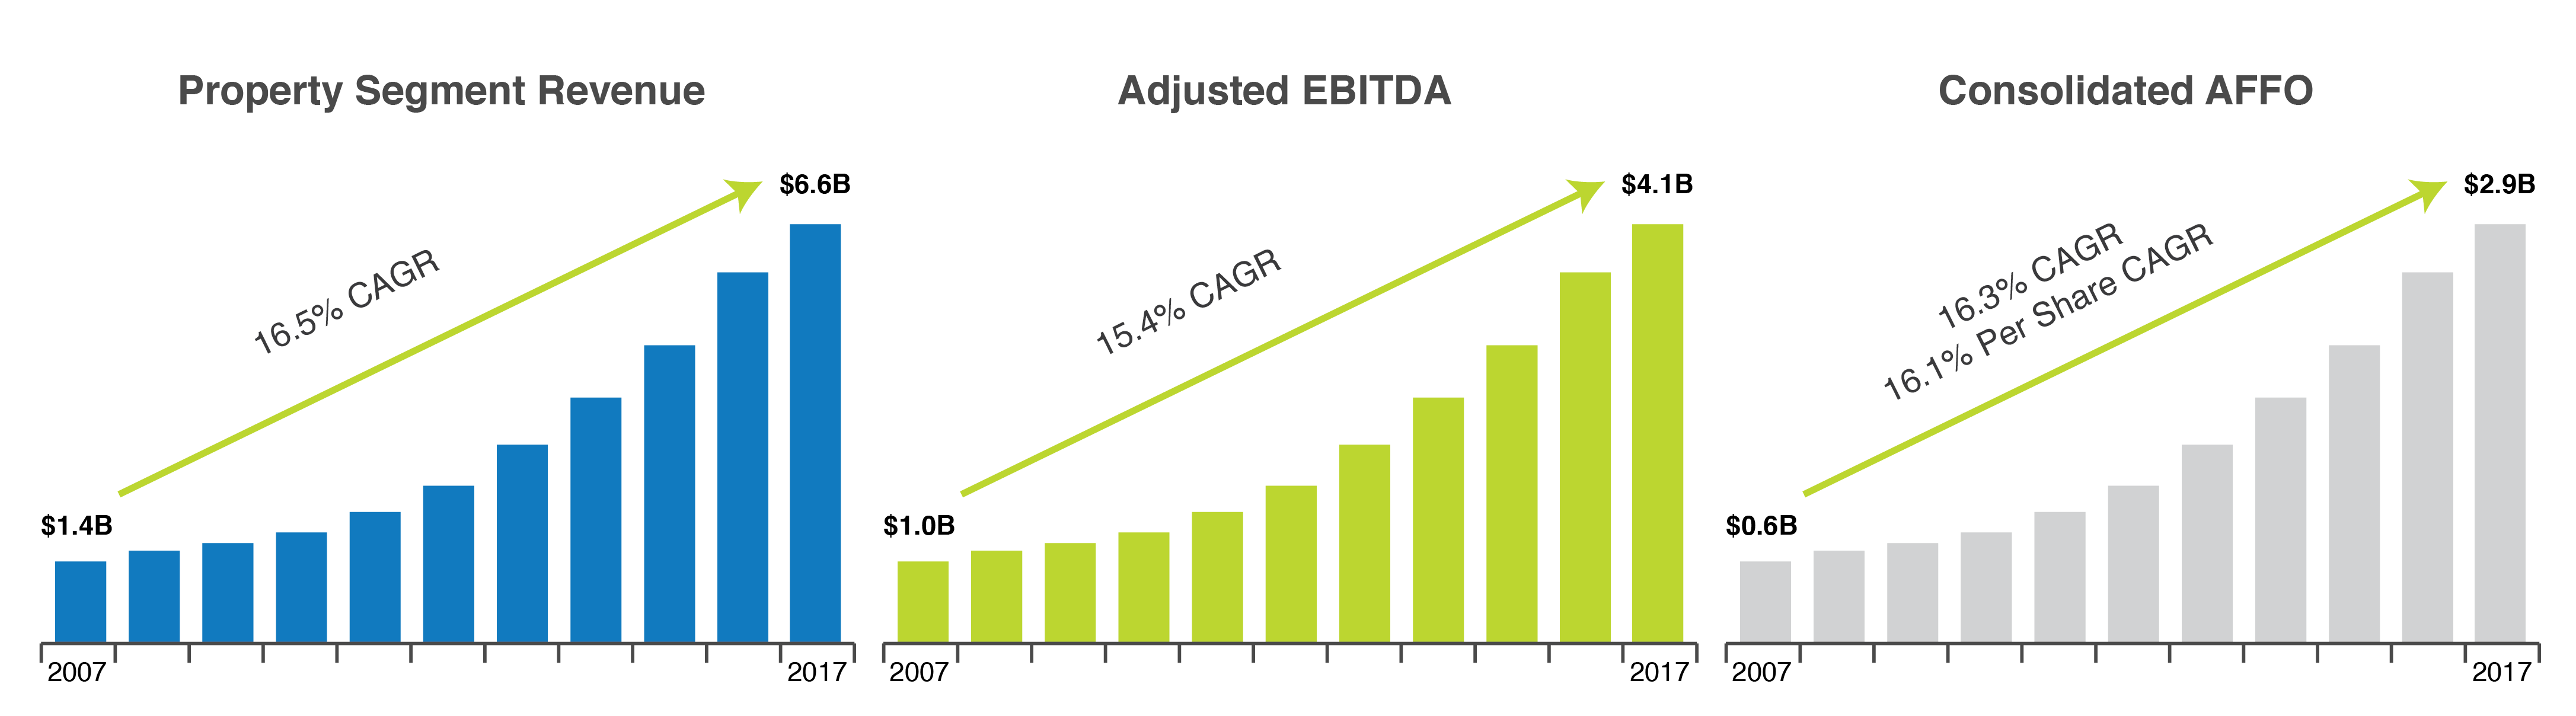
1 Net income reflects CAGR of ~36% from 2007 to 2017. Source: American Tower Corp.
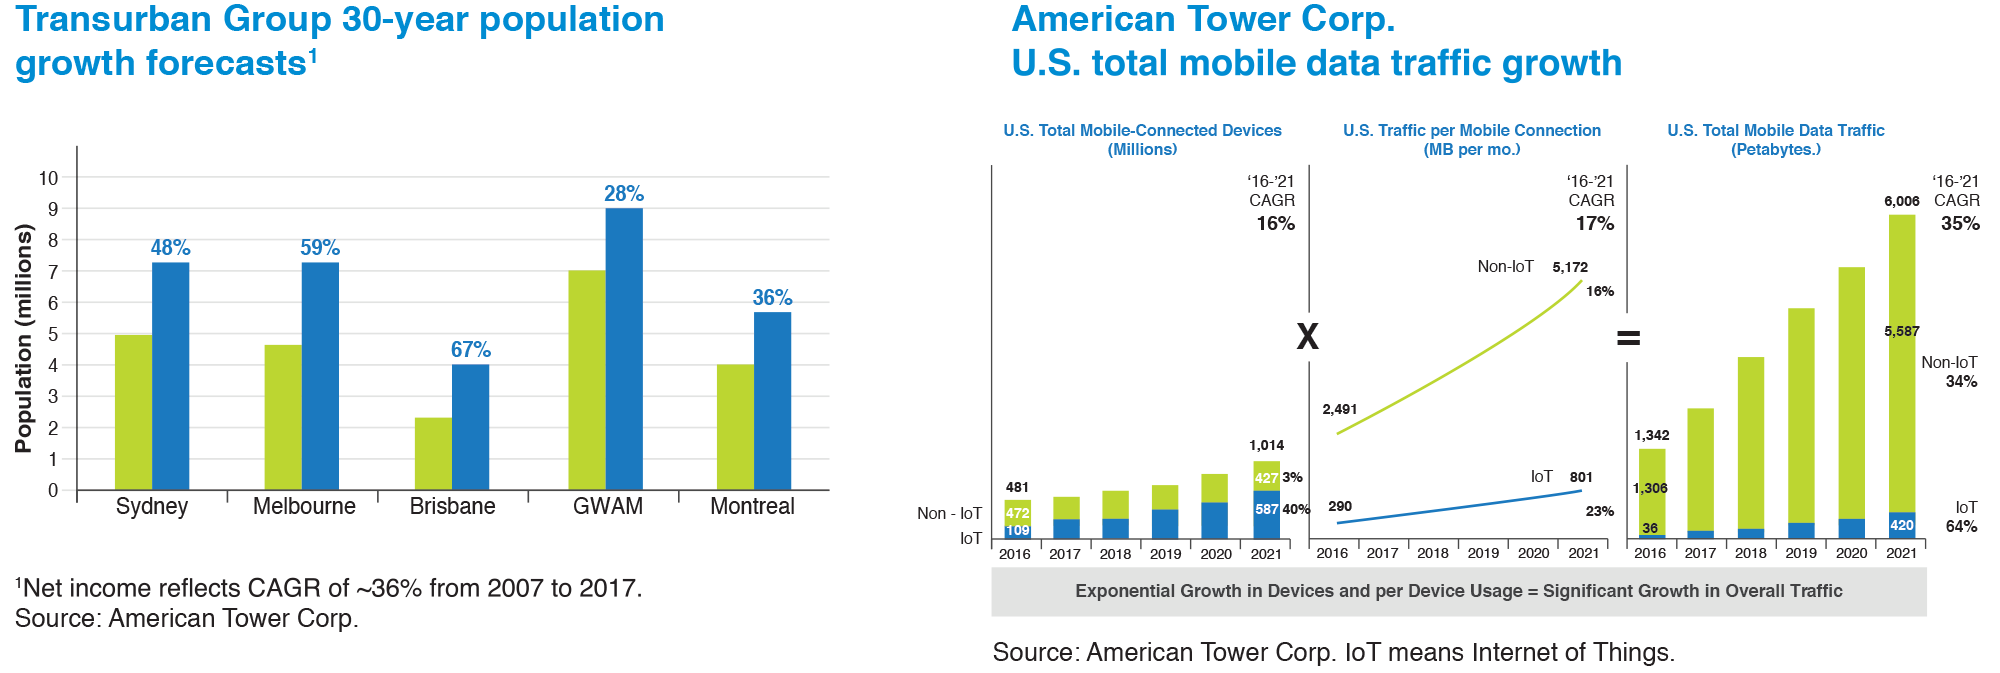
Global Macro Drivers
The unique attributes of infrastructure assets also provide them with leverage to a number of global macro trends and drivers. Globalisation has driven strong utilization growth in assets tied to global trade and transportation, such as airports, railroads, tunnels and ports. Urban congestion has spawned a number of city planning initiatives, including toll roads and passenger rail. Population growth and demographic trends also drive the utilization of many infrastructure assets such as telecom towers and healthcare facilities. Finally, years of government underinvestment in basic infrastructure has created demand for new, modern infrastructure assets operated by firms with scale and expertise.
Attractive Total Returns
Over the last decade, global infrastructure securities have delivered higher total returns than global equities. Some will say that this is a function of falling interest rates however, it is important to note that both global equities and global infrastructure securities outperformed global bonds over this time period. Infrastructure’s outperformance of global equities is more a function of the many attributes that were previously mentioned (high barriers to entry, pricing power, real cash flow growth, long term sustainability).
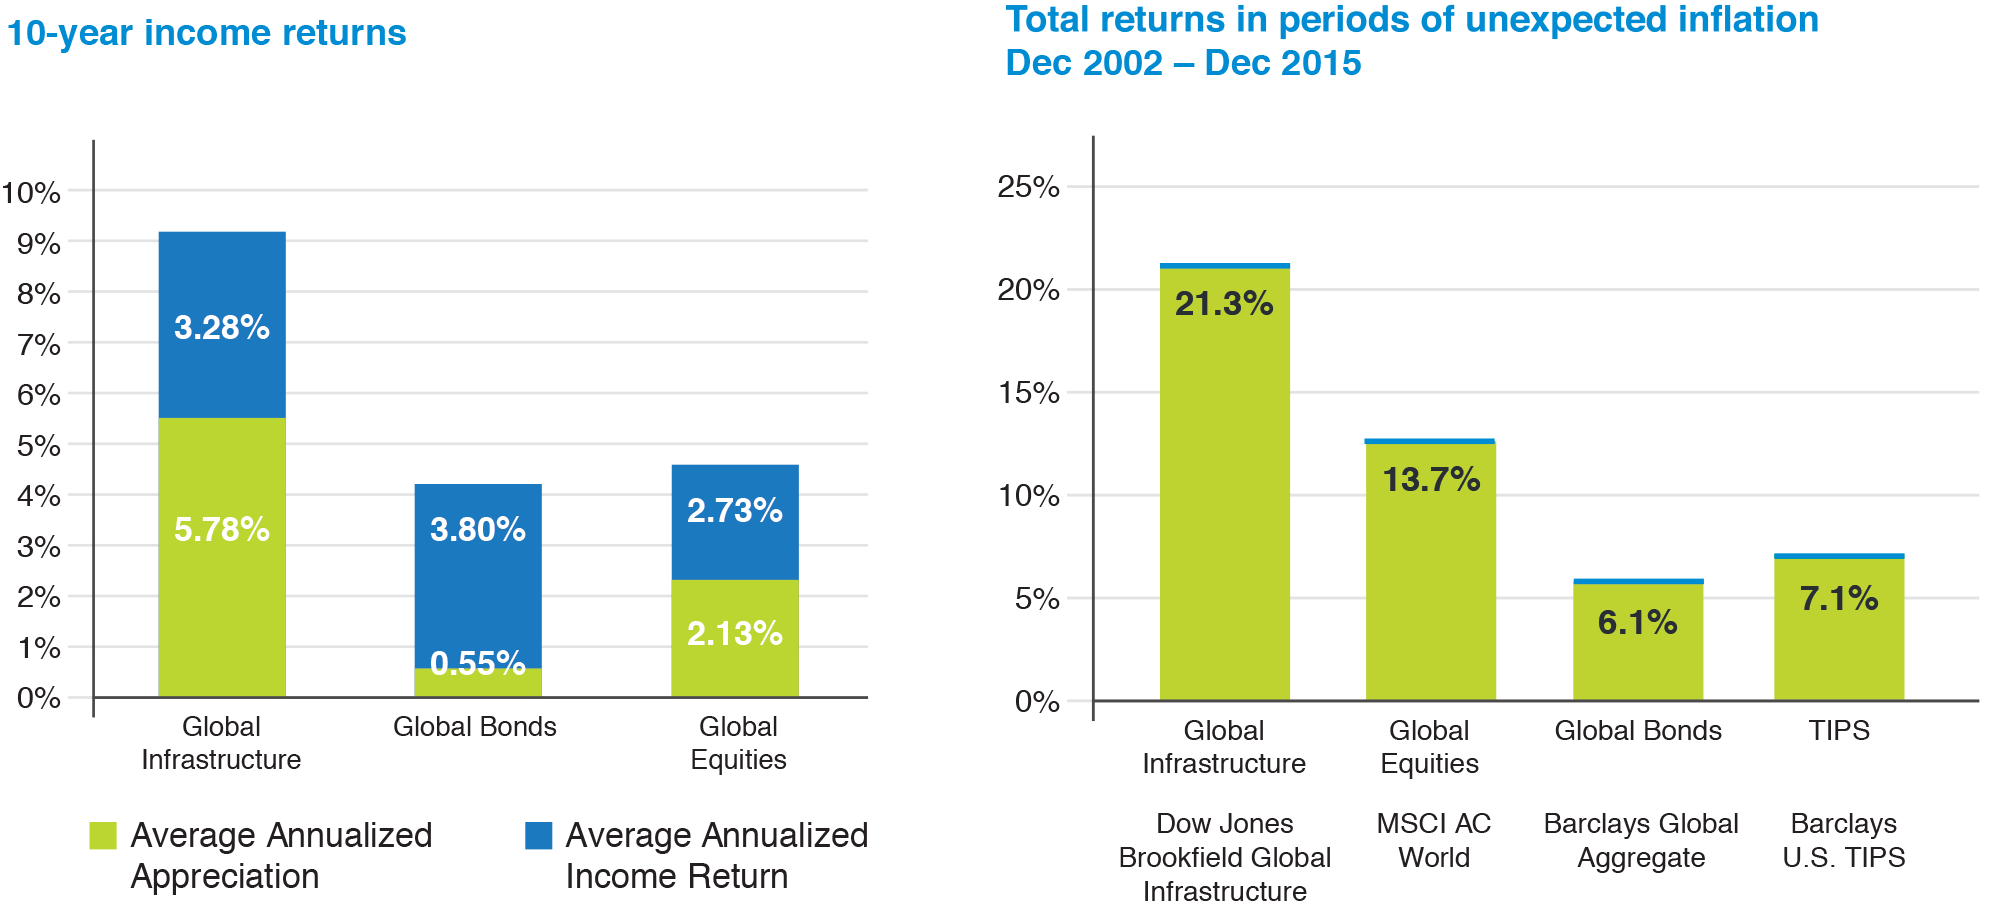
Source: Morningstar, Bloomberg and Brookfield Investment Management, Federal Reserve bank of Philadelphia Survey of Professsional Forecasters (SPF), U.S. Bureau of Labor Statistics. Data shown reflect average annual total returns in periods of unexpected inflation between December 31, 2002 - December 31, 2015. Unexpected inflation is defined as a 12-month periods during which CPI-U was higher than the trailing 12-month SPF forecast. Global Equities represented by the MSCI All-Country World Index. Global Fixed Income represented by the Barclays Global Aggregate Bond Index; TIPS represented by the Barclays U.S. TIPS index. Brookfield Investment Management has no direct role in the management of the index. Global infrastructure represented by the Dow Jones Brookfield Global Infrastructure Index and not the performance of a Brookfield composite.
Low Correlations to Other Asset Classes
Historically, infrastructure securities have shown a low correlation to other asset classes. This should mean that the addition of these securities to a portfolio should yield higher total returns per unit of risk incurred.
Infrastructure Correlations July 2000 - September 2015
| US Equities |
| Non-US Equities |
| Global Bonds |
| REITs |
| Commodities |
| Hedge Funds |
| Inflation-Linked Bonds |
| Private Equity |
| Global Infrastructure |
| Canadian Equities |
| Cash |
| US Equities | Non-US Equities | Global Bonds | REITs | Commodities | Hedge Funds | Inflation-Linked Bonds | Private Equity | Global Infrastructure | Canadian Equities | Cash |
| 1.00 | ||||||||||
| 0.87 | 1.00 | |||||||||
| 0.10 | 0.33 | 1.00 | ||||||||
| 0.62 | 0.62 | 0.29 | 1.00 | |||||||
| 0.31 | 0.43 | 0.22 | 0.17 | 1.00 | ||||||
| 0.67 | 0.76 | 0.26 | 0.48 | 0.51 | 1.00 | |||||
| 0.00 | 0.12 | 0.69 | 0.23 | 0.23 | 0.23 | 1.00 | ||||
| 0.85 | 0.89 | 0.23 | 0.73 | 0.40 | 0.74 | 0.12 | 1.00 | |||
| 0.66 | 0.80 | 0.43 | 0.60 | 0.41 | 0.69 | 0.28 | 0.70 | 1.00 | ||
| 0.80 | 0.82 | 0.25 | 0.53 | 0.58 | 0.79 | 0.17 | 0.79 | 0.67 | 1.00 | |
| -0.16 | -0.10 | 0.05 | -0.07 | 0.00 | -0.01 | 0.04 | -0.18 | 0.05 | -0.07 | 1.00 |
Pension Plan Investing
Over the last decade, Canadian pension funds have embraced investing in “alternative” asset classes, including real estate, private equity and increasingly infrastructure. According to the Pension Investment Association of Canada, the top 100 pension plans in Canada hold $171B or 8.17% of their assets under management in infrastructure assets. However, compared to the collective $267B or 12.79% allocated to real estate, infrastructure is still under-allocated towards. The same holds true for the U.S. as the chart below demonstrates.
Average Allocation to Infrastructure as a Proportion of AUM - Estimate as at October 2016

Source: Deutsche Asset Management, estimate based on Preqin database, February 2017
*Source: Pension Investment Association of Canada, Asset Mix of DB Plans of Sponsor Organizations Represented by Members as at Dec 31, 2018.
*Source: Pension Investment Association of Canada, Asset Mix of DB Plans of Sponsor Organizations Represented by Members as at Dec 31, 2018.
Starlight Capital Approach
At Starlight Capital, we have expanded the traditional infrastructure investment candidates to include companies in many non-traditional industries (stock exchanges, payments networks, digital search, logistics). This often results in portfolios with exposure to as many as eight of the 11 Global Industry Classification Standard (“GICS”) sectors. Many of the common infrastructure benchmarks only contain allocations to three of the GICS sectors (energy, industrials and utilities). This greater sectoral diversification should deliver higher risk-adjusted returns over the long term.
Despite this expansion in the definition of infrastructure there are still some risk exposures we choose to avoid. Pure services or constructions firms do not interest us. These firms often lack the long term cash flow visibility and true hard asset backstop that we seek from our infrastructure investments. This holds true for businesses with power or commodity price risk. Many of these firms must compete on price or are price-takers, which erodes any competitive advantage they may possess.
At Starlight we attempt to add value by concentrating our investments into high quality infrastructure businesses with strong value creation potential. Purchased when they offer enough return potential for the risk they expose us to these portfolios should deliver strong risk-adjusted returns to investors over the long-term.
Commissions, trailing commissions, management fees and expenses all may be associated with mutual fund investments. Please read the prospectus before investing.
Mutual funds are not guaranteed, their values change frequently and past performance may not be repeated.
Certain statements in this document are forward-looking. Forward-looking statements (“FLS”) are statements that are predictive in nature, depend upon or refer to future events or conditions, or that include words such as “may,” “will,” “should,” “could,” “expect,” “anticipate,” “intend,” “plan,” “believe,” or “estimate,” or other similar expressions. Statements that look forward in time or include anything other than historical information are subject to risks and uncertainties, and actual results, actions or events could differ materially from those set forth in the FLS. FLS are not guarantees of future performance and are by their nature based on numerous assumptions. Although the FLS contained herein are based upon what Starlight Capital and the portfolio manager believe to be reasonable assumptions, neither Starlight Capital nor the portfolio manager can assure that actual results will be consistent with these FLS. The reader is cautioned to consider the FLS carefully and not to place undue reliance on FLS. Unless required by applicable law, it is not undertaken, and specifically disclaimed that there is any intention or obligation to update or revise FLS, whether as a result of new information, future events or otherwise.
Starlight, Starlight Investments, Starlight Capital and all other related Starlight logos are trademarks of Starlight Group Property Holdings Inc.