Traffic and Toll Growth Drive Toll Road Appreciation
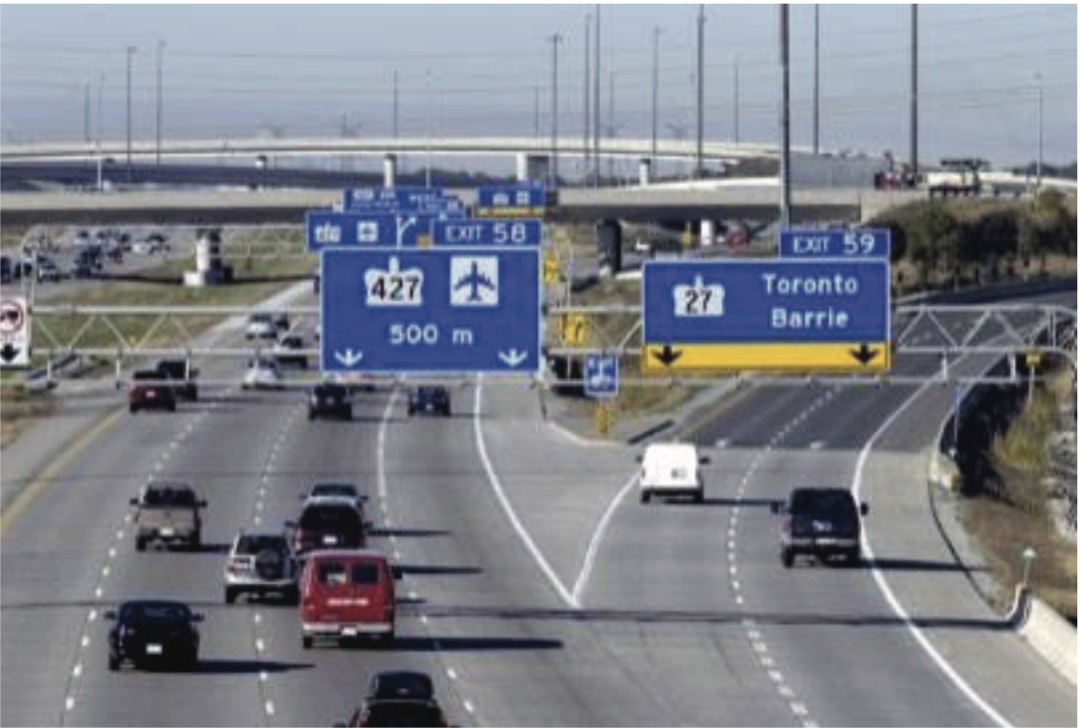
Toll road companies generally own concessions to operate a network of toll roads in a specific municipality. As vehicles enter and exit the toll road, their distance travelled is measured and
a toll is applied to generate revenue for the toll road operator. Light and heavy commercial vehicles (larger and/or more axles than a car) are charged a premium toll over the standard car toll to account for the heavier and commercial utilization of the toll road. Tolls are generally increased quarterly or annually, usually by a function of inflation with a minimum annual increase.
a toll is applied to generate revenue for the toll road operator. Light and heavy commercial vehicles (larger and/or more axles than a car) are charged a premium toll over the standard car toll to account for the heavier and commercial utilization of the toll road. Tolls are generally increased quarterly or annually, usually by a function of inflation with a minimum annual increase.
Current toll rates1

1 Current toll rates for vehicles with transponders at 30 April 2018. Different toll rates apply to vehicles without transponders.
Source: Transurban Group, Investor Day 2018
Source: Transurban Group, Investor Day 2018
It is important to note that toll road companies do not own the toll road – they own an interest in the concession to operate the toll road. The concessions are generally 20 years or longer and are structured to generate a target long-term return to the concession operator. This long-term return is based on proposed tolls, anticipated traffic levels and the duration of the concession. When the concession ends the municipality may choose to extend the concession with the current operator, a new operator or may “untoll” the road and allow commuters to use the road for free.
Toll roads are usually constructed by the firm that wins the right to operate the concession (or their construction partner in the bid) so the municipality benefits from the private funding of a large infrastructure project which reduces commute times and drives productivity gains. Depending on the concession contract, the municipality may also share in the revenue the toll road generates. Toll road operators may invest in the toll road to widen or lengthen it. Such investments are rewarded by extending the length of the concession so that the toll road operator earns a return on the additional capital invested.
Toll roads are economically-sensitive assets as tolls and traffic volumes generally rise with increased economic output (higher inflation, more people working and commuting, more commercial vehicle traffic). However, toll roads generally provide greater than anticipated downside protection during weak economic periods since tolls generally still rise (minimum annual toll increases), population growth and household formation may still be positive and commuter traffic habits show signs of inertia.
How express lanes work

Source: Caltrans
Managed lanes are like toll roads except their primary purpose is to maintain a minimum speed in the lane over the course of the day. As traffic builds on a regular road, commuters may elect to move into the managed lanes to expedite their trip. The managed lanes charge commuters a variable toll that changes as frequently as every 5 minutes. As traffic in the managed lanes rises so does the toll to ensure that a minimum speed is maintained in the managed lane.
Ferrovial SA, through its subsidiary Cintra SA, is one of the leading private developers of transport infrastructure in the world in terms of number of projects and investment volume. Cintra manages 26 toll road and managed lane concessions extending over 2,072 kilometres in Canada, the U.S., Spain, the U.K., Portugal, Ireland, Greece, Slovakia, Colombia and Australia.
Cintra owns a 43.2% stake in the 407 ETR in Toronto and is the managing partner in the ownership group (along with SNC-Lavalin Group Inc., 16.8% and CPP Investment Board, 40.0%). This asset was initially purchased in 1999 for $3.1B and Cintra estimates that the value of the 407 has appreciated 35x since the initial purchase. Given that EBITDA generated by the 407 has grown to $1.3B this estimate may prove conservative, especially with 80 years left on the concession.
Unique assets in the infrastructure world
ETR 407 Toll Road in Canada - One of a kind. 43% stake, Equity Consolidated
Source: Ferrovial, FY 2017
- Tariffs 2007-17 CAGR +9%
- EBITDA 2007-17 CAGR +10.5%
- Dividends CAD85mn’05 to CAD840mn 2017
- 100% payback First 10Y
- Valuation up 35x since ‘99
- 108kms in Greater Toronto
- Tariff freedom
- Tariff flexibility by segment, direction, time, day
- 80 years to maturity (to 2098)
- Alternative routes are strongly congested
- Fast & reliable travel times
- Free flow, electronic system
- Strong collection security
The 407 is considered one of the most lucrative infrastructure assets in the world due to its initial 99-year concession length (Transurban Group’s weighted average concession life is 29.7 years) and uncapped, dynamic tolling model (Transurban Group’s tolls are generally tied to inflation). As a result, the 407 had a payback period of 10 years, compared to the original 30-year forecast when it was constructed. Since it’s acquisition, Cintra has extended the 407 both east and west to increase traffic and extend commute lengths. Combined with the 10-year 9% annual toll CAGR and 2% annual traffic growth, the 407 continues to generate strong EBITDA growth for Cintra and, by extension, Ferrovial.
407 ETR, Toronto, Ontario (Canada): 43.2% stake (equity accounted)
It runs parallel to the first city ring road, the 401, one of North America’s most congested highways. It is one of the most valuable assets in the infrastructure world, given traffic robustness, possibility to almost freely establish the tariffs(*) and LT duration (82Y remaining to 2098).
EBITDA

Net Debt/EBITDA

Dividends

*Toll-setting freedom: Toll charges varied freely (with traffic above a certain threshold). The user pays according to the time-saving provided by the highway.
Source: Ferrovial, FY 2017
Source: Ferrovial, FY 2017
Certain statements in this document are forward-looking. Forward-looking statements (“FLS”) are statements that are predictive in nature, depend upon or refer to future events or conditions, or that include words such as “may,” “will,” “should,” “could,” “expect,” “anticipate,” “intend,” “plan,” “believe,” or “estimate,” or other similar expressions. Statements that look forward in time or include anything other than historical information are subject to risks and uncertainties, and actual results, actions or events could differ materially from those set forth in the FLS. FLS are not guarantees of future performance and are by their nature based on numerous assumptions. Although the FLS contained herein are based upon what Starlight Capital and the portfolio manager believe to be reasonable assumptions, neither Starlight Capital nor the portfolio manager can assure that actual results will be consistent with these FLS. The reader is cautioned to consider the FLS carefully and not to place undue reliance on FLS. Unless required by applicable law, it is not undertaken, and specifically disclaimed that there is any intention or obligation to update or revise FLS, whether as a result of new information, future events or otherwise.
Commissions, trailing commissions, management fees and expenses all may be associated with investment funds. Please read the prospectus before investing. Investment funds are not guaranteed, their values change frequently, and past performance may not be repeated.
Starlight, Starlight Investments, Starlight Capital and all other related Starlight logos are trademarks of Starlight Group Property Holdings Inc.