Social Menu (Header Primary)

The Time for Infrastructure is Now

Pension funds, endowments, insurance companies and other institutional asset managers have allocated capital to infrastructure for decades. They covet infrastructure for the long term, contractual revenue streams, inflation-linked growth, diversification benefits and downside protection. However, for many investors, infrastructure is still a new sector and under-represented in their portfolios.
Starlight Capital defines infrastructure as firms/assets that provide an essential service to a large portion of the population in a supply-constrained manner. This provides us with the opportunity to embrace new, technology-driven sectors of infrastructure. Payment processors, cell towers and datacentres are examples of modern infrastructure firms with long-term, structural drivers (social media, e-commerce, e-gaming, cybersecurity, internet-of-things, 5G, digital currencies, artificial intelligence, cloud computing) that collectively fall into the InfraTech subsector. As the charts demonstrate, the long-term, super-normal growth of these industries are expected to drive the long-term growth of these InfraTech businesses for many years to come.
Long-term growth charts for InfraTech businesses
Source: 1) Statista - June 2018;  2) Gartner - January 2017;  3) BI Intelligence Estimates, 2017;  4) IDC; Statista estimates, December 2018
Allocation outlook chart
Source: (1) IDC - WW Digital Transformation Spending Guide (Apr 2020); (2) IHS Markit - The 5G Economy (Nov 2019); (3) McKinsey - Navigating a World of Disruption (Jan 2019); (4) IDC - WW IoT Spending Guide (Jun 2020); (5) IDC - WW Global DataSphere (May 2020); (6) IDC - WW Big Data & Analytics Spending Guide (Apr 2019)
The essential nature of the services provided by infrastructure firms allows them to enter into long-term contracts that generate predictable revenues and cash flows. As the chart demonstrates, global infrastructure equities have historically generated higher annual EBTIDA growth with less volatility. During the 2008/2009 global financial crisis, global infrastructure firms continued to generate positive EBITDA growth, due to the essential nature of the services provided (water, electricity, transportation, waste collection, communications, etc.). While the COVID-19 pandemic has shut down many industries (malls, gyms, movie theatres, amusement parks, cruise lines, hotels, airlines), municipalities have continued to pay for services such as water, electricity, gas, communications, cargo and waste collection. This fact further demonstrates the resiliency of infrastructure cash flows during periods of economic stress and market volatility.

Infrastructure & Global Equities Annual EBITDA Growth

Chart - Infrastructure & Global Equities Annual EBITDA Growth
Source: Brookfield Investment Management research and estimates; FactSet: S&P Dow Jones Indexes; Merril Lynch Global Quantitative Strategy; MSCI; IBES; Worldscope; data as of December 31, 2015 and reflect median EBITDA growth in each respective time period. Global infrastructure represented by the Dow Jones Brookfield Global Infrastructure Composite index and not the performance of a Brookfield composite. Brookfield has no direct role in the management of the index. Global equities represented by the MSCI World Index.

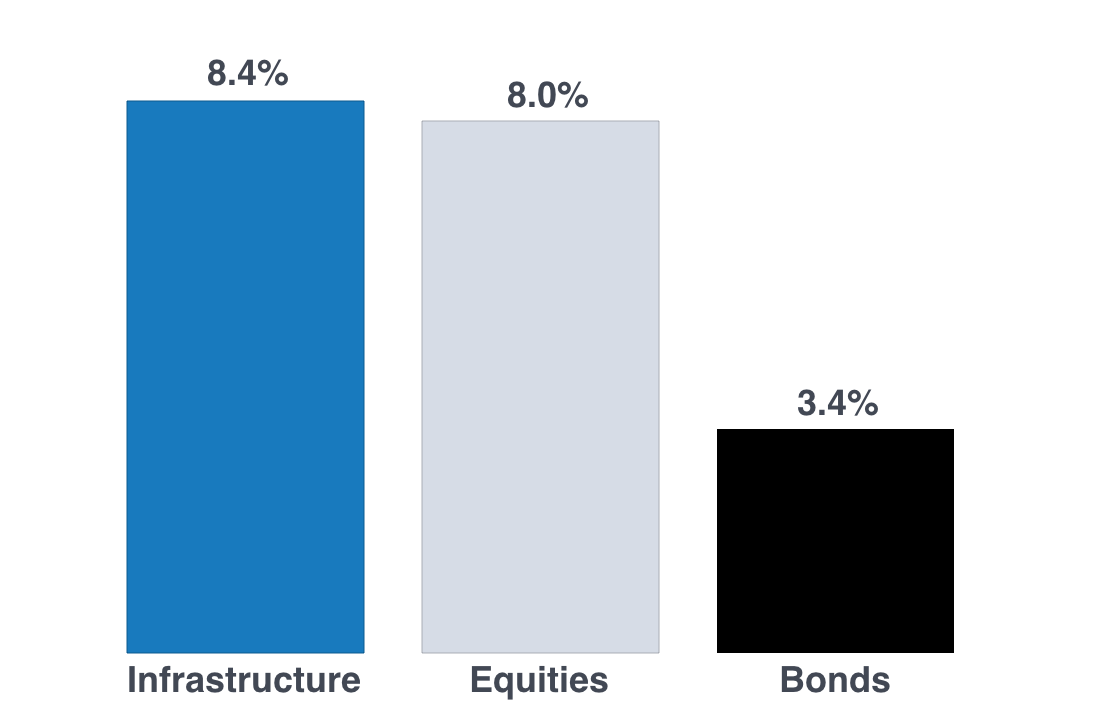
Global Asset Class Total Returns

Chart - Global Asset Class Total Returns
Source:  Bloomberg from Dec 31, 2002 to July 31, 2020. Global Infrastructure. Global Equities and Global Bonds are represented by the S&P Global Infrastructure Index (CAD). MSCI World Index (CAD) and FTSE World Broad Investment-Grade Bond Index (WorldBIG) (CAD), respectively. Past performance is no guarantee of future results.
The stable cash flow growth profile of global infrastructure equities has also led to the long-term outperformance of infrastructure equities versus global diversified equities and global fixed income. Many attribute this outperformance to the decline in long bond yields over this time period however, this overlooks the outperformance of global diversified equities compared to global fixed income during this time period. All risky investments benefit from low and/or falling interest rates (lower discount rate, lower cost of capital) however, it is those firms with growth in their cash flows that are most able to leverage this environment. This is particularly true for infrastructure equities, given their contractual cash flow streams and their demonstrated resilience through market cycles.
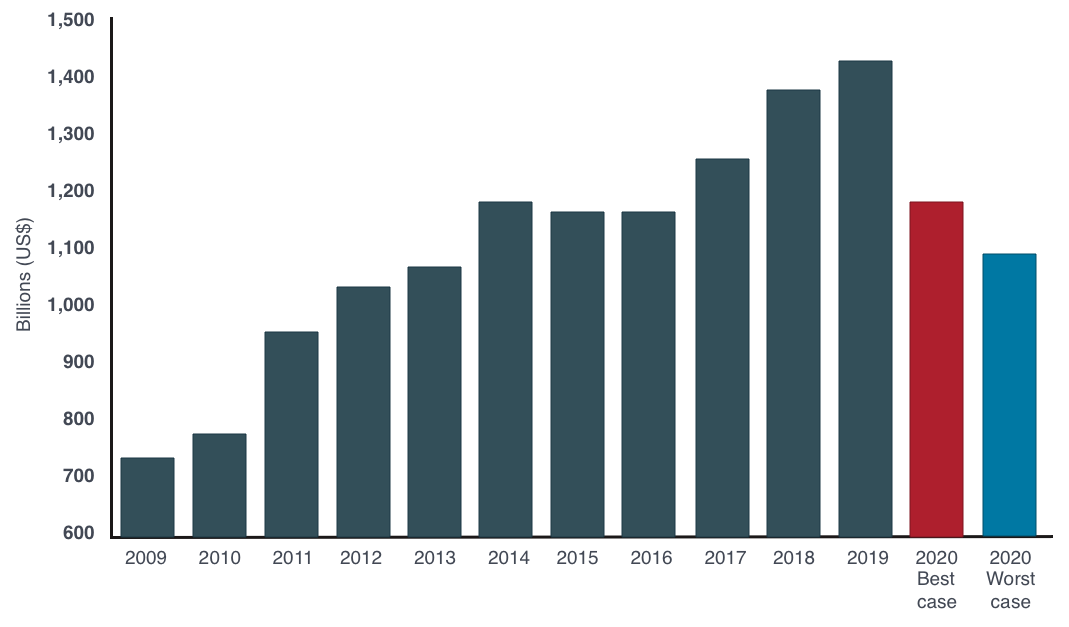
The contractual revenue and cash flow streams of infrastructure equities have the added benefit of generating consistent and growing distributions. Since inception, the Starlight Global Infrastructure Funds portfolio has experienced 60 distribution increases. In 2020, the COVID-19 pandemic has forced many companies to cease or significantly curtail operations. The resulting decline in revenues and cash flows has resulted in many firms suspending or cutting their dividends, leading to a decline in investment income for investors.

Annual Dividends

Chart - Global Asset Class Total Returns
Source:  Reuters, Globe & Mail
In contrast, year-to-date the Starlight Global Infrastructure Funds portfolio has experienced 20 distribution increases. During a time when global long bond yields are near all-time lows and global dividend income is contracting, the Starlight Global Infrastructure Fund stands out as a source of consistent and growing income.

The chart reveals that historically, companies that initiate or consistently grow their dividends have outperformed materially over the long term. In addition, they have generated this outperformance with less volatility compared to the market.

Returns of S&P 500 Index Stocks by Dividend Policy: Growth of $100

Chart - Returns of S&P 500 Index Stocks by Dividend Policy: Growth of $100
Source: Ned Davis Research, February 2020.

Average Annual Returns and Volatility by Dividend Policy

Chart - Average Annual Returns and Volatility by Dividend Policy
Source: Ned Davis Research. Dividend policies shown are for stocks in the S&P 500 Index.
The distributions from the Starlight Global Infrastructure Fund are paid on a monthly basis and are very tax efficient. In 2019, 81% of the distributions from the fund were classified as return of capital for tax purposes. The remaining 19% of distributions were classified as Canadian dividends for tax purposes. New investors in the fund will enjoy a 5.1% annual distribution1, paid monthly with excellent tax efficiency.

The team managing the Starlight Global Infrastructure Fund has over a decade of experience managing global infrastructure equities. The fund is a concentrated portfolio of great businesses purchased when they offer sufficient return for the risk incurred. This proprietary investment process has resulted in high Active Share of 85%+ and outperformance versus many equity benchmarks. The chart below also shows that the Starlight Global Infrastructure Fund has provided material downside protection during the sell-offs in Q4 of 2018 and Q1 of 2020.

Performance with Downside Protection

Chart - Performance with Downside Protection
Source: Bloomberg LP & Starlight Capital. As of August 31, 2020. The benchmarks used for analysis for the Starlight Global Infrastructure Fund is the S&P Global Infrastructure Index (CAD). The Starlight Global Infrastructure Fund Series F – 1 year: 3.5% and Since Inception: 10.9%
S&P Global Infrastructure Index – 1 year: -11% and Since Inception: 1.7%
The Starlight Global Infrastructure Fund (NEO: SCGI) can be used as a core global equity fund given that the portfolio managers have historically invested in as many as nine of the 11 GICS sectors and the fund is currently invested in six of the GICS sectors. Investors can also move from owning individual utility, energy and preferred share positions into a more diversified fund with a goal of generating higher, after-tax income.
Starlight Investments Capital LP (“Starlight Capital”) is the manager of the Starlight Global Infrastructure Fund. Commissions, trailing commissions, management fees and expenses all may be associated with investment funds. The indicated rates of return are the historical annual compound total returns net of fees including changes in security value and reinvestment of all distributions and do not take into account sales, redemption, distribution or optional charges or income taxes payable by any security holder that would have reduced returns. Investment funds are not guaranteed, their values change frequently and past performance may not be repeated. Please read the prospectus before investing. Investors should consult with their advisors prior to investing. Starlight Investments, Starlight Capital and all other related Starlight logos are trademarks of Starlight Group Property Holdings Inc.

Certain statements in this document are forward-looking. Forward-looking statements (“FLS”) are statements that are predictive in nature, depend upon or refer to future events or conditions, or that include words such as “may,” “will,” “should,” “could,” “expect,” “anticipate,” “intend,” “plan,” “believe,” or “estimate,” or other similar expressions. Statements that look forward in time or include anything other than historical information are subject to risks and uncertainties, and actual results, actions or events could differ materially from those set forth in the FLS. FLS are not guarantees of future performance and are by their nature based on numerous assumptions. Although the FLS contained herein are based upon what Starlight Capital and the portfolio manager believe to be reasonable assumptions, neither Starlight Capital nor the portfolio manager can assure that actual results will be consistent with these FLS. The reader is cautioned to consider the FLS carefully and not to place undue reliance on FLS. Unless required by applicable law, it is not undertaken, and specifically disclaimed that there is any intention or obligation to update or revise FLS, whether as a result of new information, future events or otherwise.

Active share measures the percentage a portfolio’s holdings that are different from those in its benchmark. Active share shows how the manager is actively exploiting opportunities that are not reflected in the index. The benchmarks used for analysis for the Starlight Global Infrastructure Fund is the S&P Global Infrastructure Index (CAD).

The content of this document (including facts, views, opinions, recommendations, descriptions of or references to, products or securities) is not to be used or construed as investment advice, as an offer to sell or the solicitation of an offer to buy, or an endorsement, recommendation or sponsorship of any entity or security cited. Although we endeavour to ensure its accuracy and completeness, we assume no responsibility for any reliance upon it.

Starlight mutual funds, exchange traded funds, offering memorandum funds and closed-end funds are managed by Starlight Investments Capital LP (“Starlight Capital”), a wholly-owned subsidiary of Starlight Investments. Starlight, Starlight Investments, Starlight Capital and all other related Starlight logos are trademarks of Starlight Group Property Holdings Inc. - August 2020.
© Copyright 2025 Starlight Investments Capital LP. All Rights Reserved.

Social Menu (OffCanva)

Secondary Menu - EN (OffCanvas)

Language switcher - offcanvas